The price action of the Nasdaq composite index is currently testing the psychologically significant resistance level at 16000.00, which is also the all-time highest resistance level, for a second time over the last several days. Due to the significance of this threshold as a major turning point, there is a very high probability that a second dropdown would emerge from it in the very near future.
Nevertheless, bears looking to implement contrarian trading strategies on the current setup should be careful because the underlying rally, driven by heightened investors' enthusiasm, continues to be very much active. That is so because of the robust economic data that has been posited recently.
The latest examples of this are the better-than-expected consumption numbers for October and the very strong employment growth that was recorded over the same period. Those represent very significant indications for the likely continuation of the rally further up north in the medium term. This, however, does not preclude the possibility of intermittent corrections occurring in the short term, particularly since the price action is concentrated around such a psychologically significant threshold.
That is why bears can approach the current setup by implementing contrarian trading strategies. However, they should keep in mind that this would entail heightened risk from possible adverse fluctuations and fakeouts occurring just above 16000.00. Bulls, in contrast, should remain patient.
Knowing that the underlying sentiment remains ostensibly bullish-oriented as regards the long term, they can utilise trend continuation trading strategies. Once the next correction reaches a dip, they would be able to enter long there at a discount.
Where Will the Correction Bottom Out?
As can be seen on the daily chart below, the price action of the Nasdaq composite index has been establishing an Ascending Wedge since late July. This type of pattern typically signifies likely bearish reversals, which corroborates the expectations for the emergence of a correction in the near term. This is further bolstered by the fact that the bottleneck of the Wedge is taking shape close to the psychological resistance at 16000.00, making it an even likelier turning point.
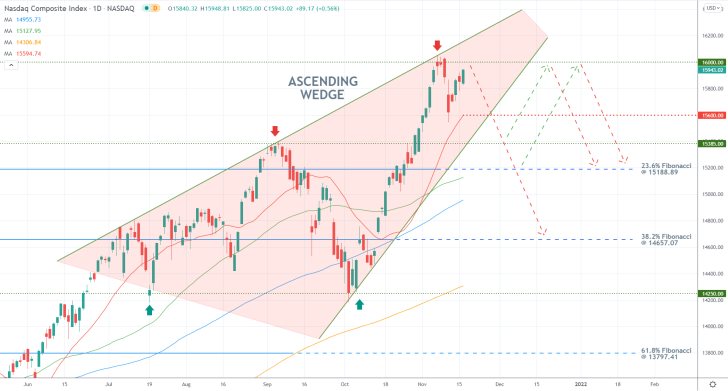
The first time the price action reached the 16k mark, an initial dropdown ensued, as was forecasted by our previous analysis of the index. It bottomed out just above the major support level at 15600.00, which is underpinned by the 20-day MA (in red). Then, a bullish pullback ensued, which is currently drawing near to the 16k mark yet again. That is why a second correction would likely follow a second denial at this historical resistance.
Unsurprisingly, the first target for such a dropdown would once again be the 15600.00 resistance-turned-support level. If the price manages to break down below it and the lower limit of the Wedge, its next target would be the major support at 15385.00 (previous swing high). The third is the 23.6 per cent Fibonacci retracement level at 15188.89, which is about to converge with the 50-day MA (in green) and the 100-day MA (in blue).
Waiting for a Break Below the Regression Channel
The behaviour of the price action on the 4H chart below gives us even more reasons to anticipate a second dropdown from the psychological resistance. Notice that the latest upswing, which commenced following the completion of the previous ABC correction, is underpinned by a regression channel.
Following the initial test of the 16k threshold, the price action dropped to the lower limit of the channel, which at that time coincided with the 15600.00. For the time being, the price action is concentrated within the lower portion of the channel, signifying mounting bearish bias. Additionally, the middle line of the channel just crossed above 16k., making it an even more significant resistance level.
The steadily increasing bearish sentiment was also picked up by the MACD indicator. Notice that its 12-day EMA (blue) recently crossed below the 26-day EMA (orange), which represented the first indication of mounting bearish momentum. Moreover, the histogram of the indicator has also been steadily declining since early October, which is demonstrative of a divergence in the making. All of these indications corroborate the expectations for a sizable bearish correction in the near future.
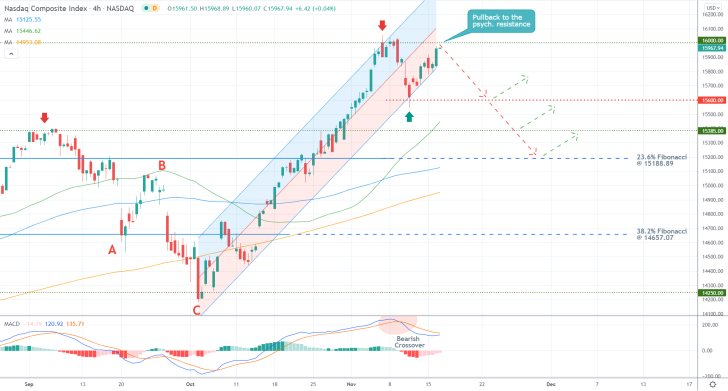
It should also be mentioned that the 50-day MA (in green) is drawing closer to the 15600.00 support, making it even more prominent. The 100-day MA is already practically converging with the 23.6 per cent Fibonacci to the same effect. The 200-day MA (in orange) is also slowly rising towards the latter, which would add to its prominence as a likely turning point.
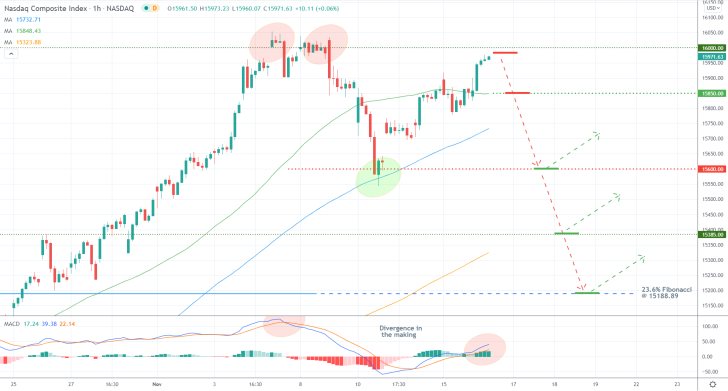
The MACD on the hourly chart below highlights this divergence in greater detail. Notice that the histogram has already started to decline over the last several hours while the newest wave (comprised of the two EMAs) would likely peak way below the one preceding it. All of this corroborates the expectations for another reversal from 16k.
Additionally, the gap between the 50-day MA and the 100-day MA is becoming increasingly narrower, which underpins the waning strength of the latest upswing.
Concluding Remarks
Bears can look for an opportunity to sell short around the current spot price immediately following today's market open, provided that there is not a massive gap between the open and yesterday's close. Their supporting stop-losses should not be placed more than 70 basis points above 16000.00 (the all-time high). Once the correction draws near to 15600.00, they can substitute their fixed stop orders for floating TPs. That way, they would be able to catch the maximum out of a potential dropdown towards the 23.6 per cent Fibonacci while simultaneously protecting themselves against sudden changes in the direction of the price action.
More risk-averse bears can enter the market once the price breaks down below 15850.00 (underpinned by the 50-day MA on the hourly chart) decisively. Their supporting stop-losses should not exceed 60 basis points from their initial entries.
In turn, bulls should consider re-joining the broader rally only once there are sufficient indications that the correction has already reached a dip. This would likely happen at one of the aforementioned support levels.
The Nasdaq Possibly Develops a Head and Shoulders Pattern
The price action of the Nasdaq composite index may be due for another bullish pullback shortly, as part of a currently developing Head and Shoulders. The emergence of such a broad trend reversal pattern around the psychologically significant resistance level at 16000.00 could therefore signify the likely development of a more substantial market correction.
The price action already established a minor dropdown over the last several days, as was forecasted by our initial analysis, because of the escalating tensions along the Russia/Ukraine border. However, the dropdown appears to have been held back at the recent swing low, as can be seen on the 2H chart below. This presupposes a likely bullish rebound currently in the making.
The catalyst for such a temporary pullback may very well be the quarterly GDP data, which is scheduled for publication later today. According to the preliminary forecasts, the U.S. economic growth likely accelerated in the three months leading to September.
This is the data that could reinvigorate investors' optimism, at least for a little while. Enough to continue the establishment of the massive Head and Shoulders pattern.
The underlying setup is thus suitable for the implementation of contrarian trading strategies by bears looking to once again sell around the psychologically significant resistance level at 16000.00.
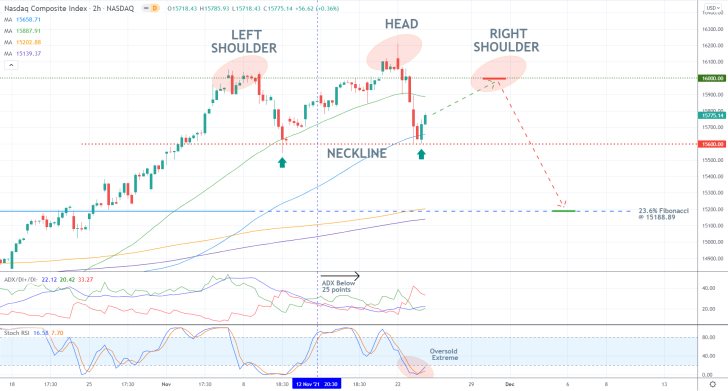
The Neckline of the pattern appears to be the major support level at 15600.00, which was just crossed by the 100-day MA (in blue). This makes it an even more prominent threshold. Therefore, the price action is likely to rebound from it, which would probably lead to the establishment of the pattern's Right Shoulder.
A significant indication of the mounting bearish sentiment in the market is the fact that the dip of the Left Shoulder occurred from the 50-day MA (in green), but this time, though at the same support level, the rebound occurred from the 100-day MA.
Moreover, the ADX indicator has been threading below the 25-point benchmark since the 12th of November, while the Stochastic RSI has just entered into its oversold extreme. Both signals are congruent with the expectations for another pullback to the psychological resistance at 16k, followed by a more significant bearish reversal.
Bears can therefore place short limit orders at this psychologically significant resistance level in anticipation for the completion of the Head and Shoulders pattern. Their stop-loss orders should not be placed more than 70 basis points above 16000.00.
The first major target will be the 23.6 per cent Fibonacci retracement level at 15188.89, where bears can place their take-profit orders. The prominence of the latter is further substantiated by the fact that it is currently converging with the 200-day MA (in orange) and the 300-day MA (in purple).
Classic Trend Reversal Setup on the Nasdaq
The price action of the Nasdaq index would likely continue to depreciate in the following days amidst a selloff of higher-risk assets. This is prompted by the advent of the new Omicron variant. The underlying setup is thus suitable for the implementation of contrarian trading strategies.
FED Chair Jerome Powell testified before the U.S. Senate yesterday, and in his testimony, he referred to soaring consumer prices as representing the chief impediment to recovery. Powell's statement thus paved the way for a possible rate hike in 2022, as the FED tries to negate the impact of the global supply and demand imbalances.
This new hawkishness of Powell and the FED is bad news for investors, as a dial back of the bank's asset purchases programme would make speculation with stocks less favourable. Provided that the market does not open with a massive gap today, traders can take advantage of this by trading on the expectations for a new correction.
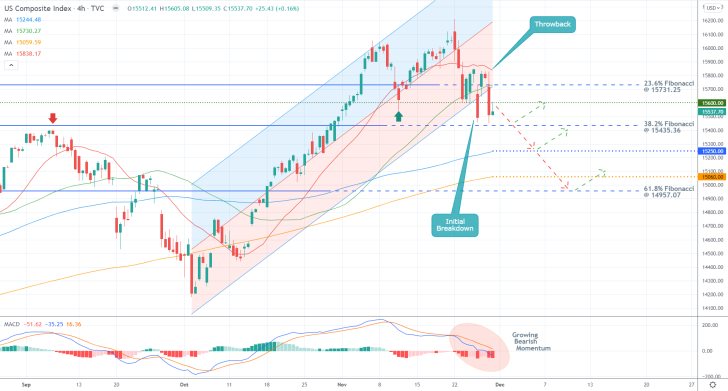
The beginning of a new trend reversal is represented on the 4H chart above. This is demonstrated by the breakdown below the lower limit of the regression channel, coinciding with a penetration below the 23.6 per cent Fibonacci retracement level at 15731.25. Meanwhile, the rising selling pressure in the market is elucidated by the histogram of the MACD indicator.
Notice that the initial breakdown was held back by the 38.2 per cent Fibonacci at 15435.36. It was followed by a throwback to the 20-day MA (in red). Subsequently, a second dropdown developed, which confirms the growing bearish bias. The crossover between the 23.6 per cent Fibonacci, the lower limit of the channel and the 50-day MA (in green), has thus turned into a new major resistance level.
Bears can look for an opportunity to enter short around the current spot price, provided that the market does not open with a massive gap later today. They can place their supporting stop-loss orders just above the previous swing low at 15600.00. Once the price action breaks down below the 38.2 per cent Fibonacci, they would be able to substitute those fixed stop orders for floating TPs.
The first target for the downtrend is underpinned by the major support level at 15250.00, which is highlighted by the 100-day MA (in blue). The second target can be found at 15060.00, underpinned by the 200-day MA (in orange).
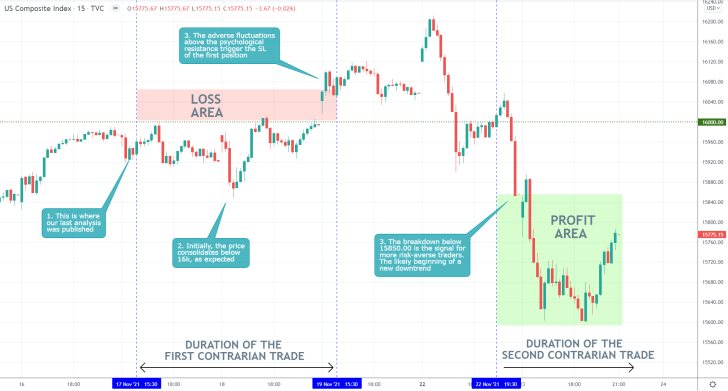
- The expectations of our Nasdaq analysis are more or less being realised. Shortly after its publication, the price action of the index consolidated just below the psychologically significant resistance level at 16000.00, as was expected. However, some adverse fluctuations above this major threshold triggered the stop-loss of the first selling position.
- This is why traders need to implement very narrow SLs when using contrarian trading strategies around such major turning points.
- In this case, patience was a virtue because the price action did eventually reverse itself, and more risk-averse bears were able to enter short following the breakdown below 1585.00.
- This represents yet another example of why sometimes traders have to execute several trades before they gain a favourable entry.
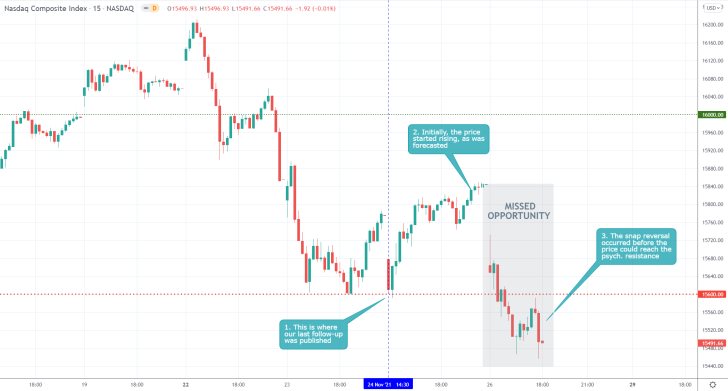
- Shortly after the publication of our last Nasdaq follow-up, the price action rebounded from the Neckline at 15600.00. However, the rebound did not reach the psychologically significant resistance level at 16000.00, which was necessary for the completion of a major Head and Shoulders Pattern.
- The sudden reversal midway between the two levels meant that the short limit order at 16000.00 could not be filled, and therefore the opportunity was missed.
- The selloff was prompted by the new coronavirus variant.
- The big takeaway here is that traders should not feel frustrated for missing out on an opportunity due to unforeseeable circumstances. This is detrimental to their mental stamina.
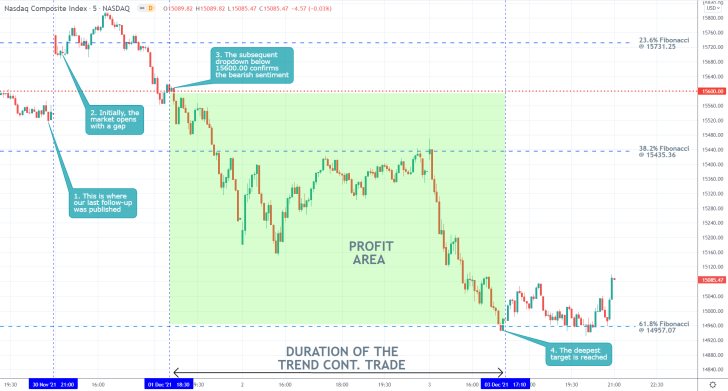
- Our latest Nasdaq follow-up successfully caught the dropdown to the 61.8 per cent Fibonacci retracement level at 14957.07, just below the psychologically significant support level at 15000.00.
- Immediately following the release of the follow-up, the price action opened the daily session with a massive bullish gap. This precluded the possibility for an immediate short entry.
- Nevertheless, the reversal from the 23.6 per cent Fibonacci and subsequent breakdown below 15600.00 demonstrated the strong bearish bias in the market, allowing short entry.
Disclaimer: Your capital is at risk! Trading and investing on the financial markets carries a significant risk of loss. Each material, shown on this website, is provided for educational purposes only. A perfect, 100% accurate method of analysis does not exist. If you make a decision to trade or invest, based on the information from this website, you will be doing it at your own risk. Under no circumstances is Trendsharks responsible for any capital losses or damages you might suffer, while using the company’s products and services. For more information read our Terms & Conditions and Risk Disclaimer.


