The Nasdaq Composite index has advanced considerably over the past few weeks, even though the underlying sentiment is not ostensibly trending. This is caused by mounting adverse volatility in the market. These erratic fluctuations could prompt a broader bearish correction in the near future.
Selling pressure continued to accumulate yesterday following Jerome Powell's, Chair of the Federal Reserve, testimony before the U.S. Senate. He testified on FED's current monetary policy stance, and the markets reacted to the speech by betting against the U.S. dollar.
Despite upbeat growth data, general liquidity remains subdued due to the impact of market seasonality. This could catalyse another bearish correction as adverse volatility takes hold of the stock market.
The End of the ABCD Pattern in Sight
As can be seen on the daily chart below, the price action is coming close to completing a major ABCD pattern, which implies the likelihood of such a bearish reversal. The prominence of this structure stems from the fact that its impulse and retracement legs are proportional to each other.
The distance between the dips at A and C is 0.618 per cent, which is a Fibonacci retracement. It can also be seen that the final impulse leg (CD) is drawing near to completion. This can be inferred from the fact that the price action is coming very close to the point where the distance between the peaks at B and D would be 1.618 per cent.
Thus, a bearish reversal is likely to occur near the 14900.00 level, which is positioned very close to the psychologically significant resistance level at 15000.00. In addition to the fact that the latter has never been reached before, the accumulation of so many zeroes in the number itself is substantial enough to prompt a sharp reversal.
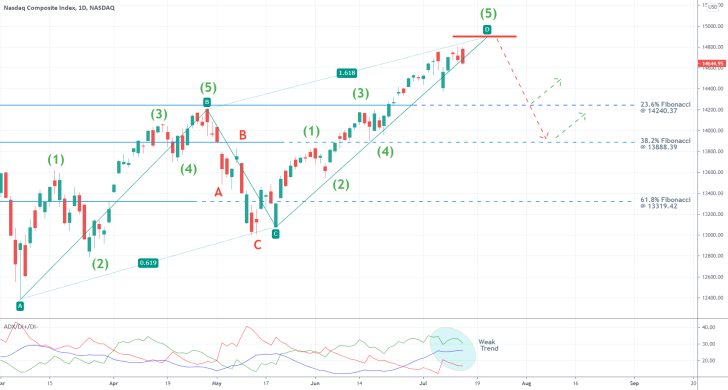
Moreover, the underlying market sentiment remains mostly neutral. This is demonstrated by the ADX indicator, which has shot above the 25-point benchmark only two days ago. With an underlying trend that is so weak, the likelihood of sudden changes in the direction of the rice action is bolstered.
Unsurprisingly, the next bearish correction is likely to fall to one of the closest Fibonacci barriers. This can be either the 23.6 per cent Fibonacci at 14240.37 or the 38.2 per cent Fibonacci at 13888.39. Bulls should keep in mind that the price action could rebound sharply from either of them, akin to what happened recently.
Another reason to anticipate a bearish reversal around 14900.00 stems from the fact that the price action is currently advancing within the boundaries of a 1-5 impulse wave pattern, as postulated by the Elliott Wave Theory. In fact, previous impulse and retracement legs also comprise prominent Elliott structures, which substantiates the expectation for another such dropdown from 5.
Waiting for a Breakdown from the Regression Channel
As can be seen on the 4H chart below, the last impulse leg of the ABCD pattern, constituting a 1-5 impulse wave pattern on its own, is represented as a regression channel.
The price action is currently flirting with the channel's middle line in preparation for its concentration within the lower portion of the channel. The recently failed breakdown below said line represents an early attempt for that.
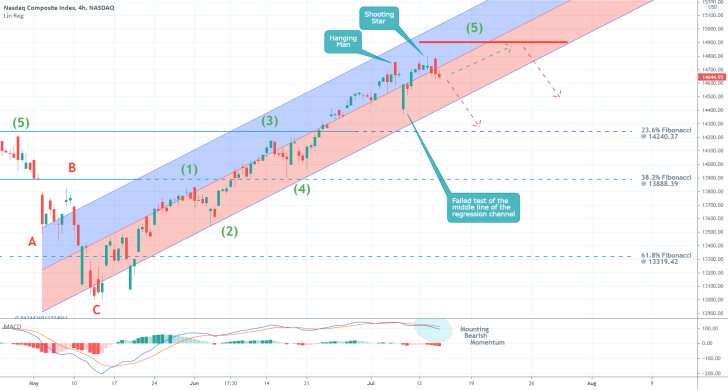
Meanwhile, the recent emergence of a Hanging Man and Shooting Star candles in a swift concession underscore the mounting selling pressure in the short term. This is also signified by the mounting bearish momentum on the MACD indicator.
It would take a decisive breakdown below the lower boundary of the regression channel to confirm the beginning of such a bearish correction.
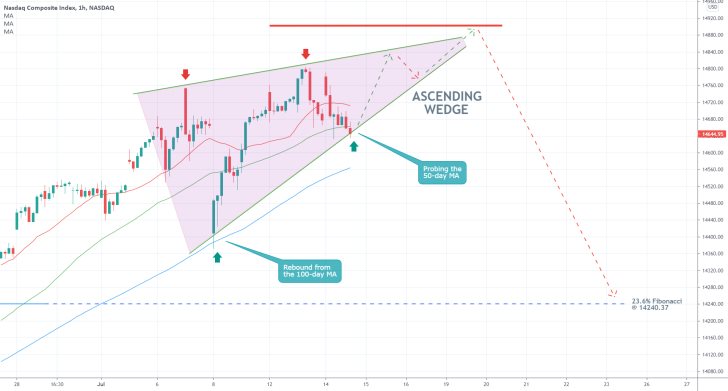
Given the most recent behaviour of the price action, the actual reversal is likely to take the form of an Ascending Wedge pattern, as shown on the hourly chart below. This, however, is more of an informed conjecture rather than a precise prediction.
Still, it serves the purpose of reminding bears that they should not enter short prematurely. Instead, they should observe whether the price action starts establishing lower peaks. This would represent a strong indication that the market is indeed ready to reverse its direction.
It is also worth mentioning that there was a sharp rebound from the 100-day MA (in blue) on the first test of the moving average. Currently, the price action is probing the 50-day MA (in green).
A potential consolidation around the 50-day MA but below the 20-day MA (in red) would also be demonstrative of mounting selling pressure in the short term.
Concluding Remarks:
Depending on their level of risk-aversion, bears can look for several types of potential entries into the market.
Less risk-averse traders can look for an opportunity to sell the Nasdaq either on the condition that the price action penetrates below the regression channel (as seen on the 4H chart) or the 100-day MA (hourly chart).
They should look for decisive breakdowns only. At the same time, they should also keep in mind that there is a strong possibility for adverse fluctuations towards 14900.00, or even slightly above. That is why they might have to place several orders before they catch the actual reversal.
More risk-averse traders, in contrast, could wait for the price action to reach 14900.0 first before they place their selling orders. If the price action does reach that level indeed, bears should keep in mind that the likelihood of adverse fluctuations towards the psychological resistance at 15000.00 would be bolstered.
Nasdaq at an All-Time High Ahead of Big Tech Earnings
Before the close of last week's session, the price of the Nasdaq composite came very close to the psychologically significant resistance level at 15000.00, which is a significant make-it-or-break-it threshold. The price closed at 14836.99, which is an all-time high.
This happened just before the highly anticipated earnings data of Big Tech, which is set to excite markets this week. Investors' enthusiasm surrounding the earnings data of some of the biggest tech giants - Apple, Alphabet, Microsoft, and Amazon - this week would very likely cause an upsurge in volatility over the next several days.
The consensus forecasts expect the companies to deliver robust quarterly performance once again; however, this heightened enthusiasm would only add to the responsiveness of the market to even the most subtlest of surprises in the revenue data of each of the companies.
In other words, the price of the Nasdaq Composite is likely to become especially volatile over the short term as trading activity increases. This means that trading orders should be structured in such a way that would take into consideration these expectations for increased volatility.
The use of simple market orders is not recommended under these particular circumstances, as they guarantee quantity filling but not necessarily at the desired price level. Since precision of execution is especially important in such volatile environments, the use of limit orders seems a better choice.
Limit orders guarantee the execution of a trade at a specific price, which is a good way of negating the risk of adverse fluctuations.
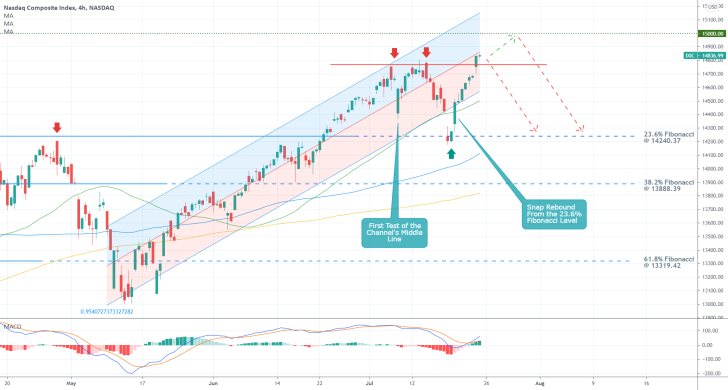
As can be seen on the 4H chart above, the last upswing is represented using an ascending regression channel. Following the recent rebound from the 23.6 per cent Fibonacci retracement level at 14240.37, the latter took the role of a major resistance-turned-support.
Subsequently, the price reached the current resistance level at 14850.00, which has held on two separate occasions so far. This means that a reversal from it seems probable. Moreover, the price action is also consolidating near the middle line of the channel, which increases the likelihood of a reversal around the current spot price.
Despite all of these indications, bears anticipating another correction shouldn't rush to enter short immediately after today's open. They should take into consideration the fact that the psychological barrier at 15000.00 is a preferred hunting ground for market wales, who know that smaller retail traders are likely to place their stop-losses around it.
More risk-averse bears could place their short limit orders at 15000.00, with supporting SLs just above it. The first target is the 23.6 per cent Fibonacci. If the price falls below it, bears could substitute their fixed stop orders for floating TPs. The next deeper target level can be found at the 38.2 per cent Fibonacci at 13888.39.
On the condition that the price opens today's session with a gap and then starts falling immediately, bears should only consider selling if the price breaks down below the 50-day MA (in green) decisively.
The Nasdaq May Yet Bounce Up Towards 15000.00
The Nasdaq Composite has been fluctuating in range, without any inherent logic, over the last several trading days, on the hit and miss earnings season in the U.S. This is owing to the diverging indications in the quarterly reports of Big Tech.
On the one hand, Tesla and Apple managed to crush Wall Street's forecasts. The two giants delivered exceptionally robust earnings numbers for the second quarter, despite persisting supply bottlenecks. However, Amazon's performance disappointed as the retailer posted weaker-than-expected revenue growth.
With all of the remaining uncertainty, the price action of the index may continue to fluctuate towards the psychologically significant resistance level at 15000.00 before directional trading with a conviction may be resumed.
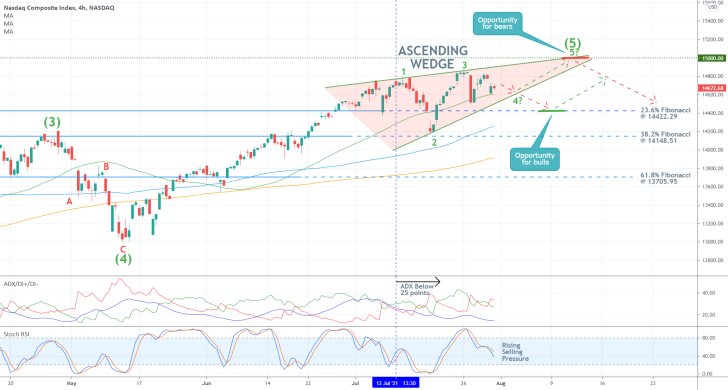
As was argued in the initial analysis of the index, the price action appears to be establishing a massive 1-5 impulse wave pattern, as postulated by the Elliott Wave Theory. It is currently in the process of establishing the last impulse leg (4-5), which is likely to peak near the psychologically significant resistance level at 15000.00.
Not only that, but the last impulse leg appears to be taking the form of a minor 1-5 impulse wave pattern itself. The likely completion of such a prominent pattern around the crucially important threshold at 15000.00 - a level that has never been reached before - is what gives credence to the expectations for another bearish correction.
Furthermore, the most recent behaviour of the price action is taking the form of an Ascending Wedge. When found near the peak of an uptrend, this is a type of pattern that is typically taken to signify likely bearish reversals. Hence, there is a confluence of bearish indications, all pointing to the same conclusion.
The ADX fell below the 25-point benchmark on the 12th of July, which means that the underlying trend has weakened to the point where the market is no longer considered to be trending. Given the mounting selling pressure, as underpinned by the Stochastic RSI indicator, this is also indicative of a probable bearish reversal.
However, bears should not rush to sell right away. The price action could fall to the lower boundary of the Wedge, which is currently converging with the 50-day MA (in green) before it rebounds towards the 15000.00 resistance.
Bears can consider selling only on the condition that the price action reverses from the psychological resistance level. They should place stop-loss orders that are no more than 100 basis points away from this threshold. The first target for such a dropdown is underscored by the 23.6 per cent Fibonacci retracement level at 14422.29.
Bulls, in contrast, should consider going long only if the price action falls to the 23.6 per cent Fibonacci, and there are clear indications that it will not fall any further. Notice that the 100-day MA (in blue) is about to converge with this major support. Bulls should apply the same type of approach with regard to risk management. Unsurprisingly, they would be eyeing an upswing towards 15000.00.
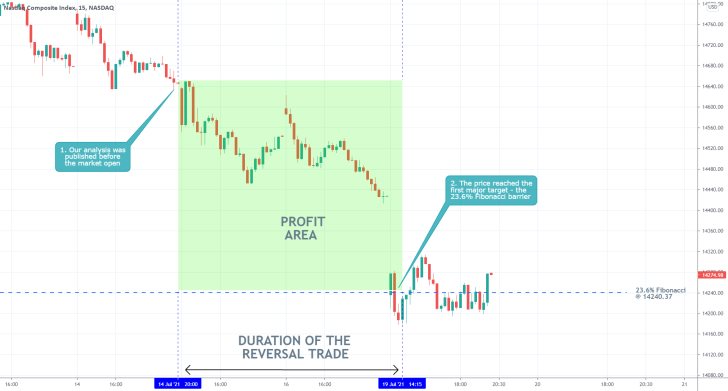
- The price of the Nasdaq composite started depreciating almost immediately following the publication of our last analysis of the index, as expected. The price reached the first target - the 23.6 per cent Fibonacci retracement level at 14240.37.
- However, not all traders could utilise this opportunity. More risk-averse traders would have waited for the upswing to be extended a little bit higher before entering short, meaning they would have missed the breakdown.
- Sometimes playing on the safe side in trading can mean missing out on good opportunities. However, that does not mean that traders should trade on EVERY opportunity they see.
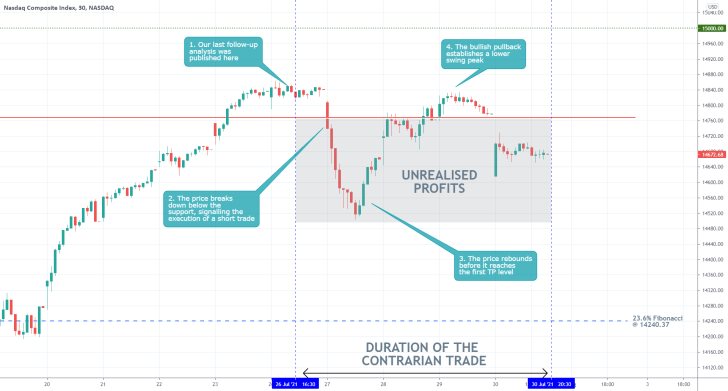
- Shortly following the publication of our last follow-up analysis of the Nasdaq Composite, the price action did start to go down as expected. However, it rebounded before the first target level at the 23.6 per cent Fibonacci retracement level at 14240.37 was reached.
- The following fluctuations that occurred within the boundaries of a minor range were caused by the different earnings indications from the Big Tech companies. In other words, the diverging quarterly performances of some of the biggest companies in the tech sector caused the undecided price action.
- In most cases, it is better to close your underlying position in such volatile and uncertain environments, especially when it was initially opened on the expectations for directional trading.
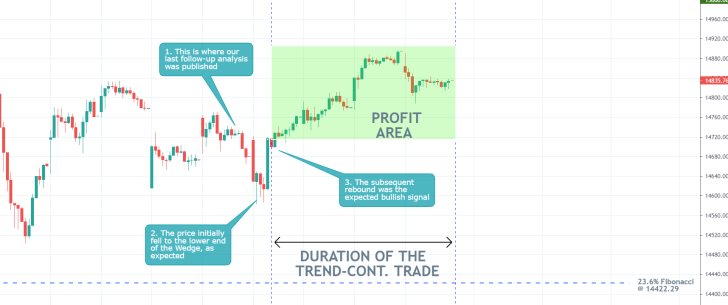
- Our last follow-up analysis of the Nasdaq composite index successfully projected a bullish rebound from the lower limit of an Ascending Wedge pattern. The price action continues to appreciate towards the psychologically significant resistance level at 15000.00.
- So far, our trade has caught more than 120 basis points since the rebound took place.
- Bulls should keep in mind that a bearish reversal is likely to occur from this major turning point.
Disclaimer: Your capital is at risk! Trading and investing on the financial markets carries a significant risk of loss. Each material, shown on this website, is provided for educational purposes only. A perfect, 100% accurate method of analysis does not exist. If you make a decision to trade or invest, based on the information from this website, you will be doing it at your own risk. Under no circumstances is Trendsharks responsible for any capital losses or damages you might suffer, while using the company’s products and services. For more information read our Terms & Conditions and Risk Disclaimer.


