The earnings season in the U.S. is gaining speed, and Morgan Stanley is the next financial institution in line to report quarterly earnings for the three months to December 2020. The bank is set to do so tomorrow before the market open. JPMorgan Chase kicked-off the cycle last week.
Morgan Stanley's share price is currently consolidating just below a historically significant resistance level, which was last reached in June of 2007. This happened right before the debt bubble burst, resulting in the infamous credit crunch. As it happens, the price action is once again probing this crucial barrier just as Morgan Stanley is about to deliver its Q4 figures; an event that is bound to garner traders` interest, resulting in volatility upsurges. And all of this is taking place during a week that already looks poised to be quite eventful.
Morgan Stanley's stock price currently finds itself at a make-it-or-break-it point, and the expected increase in underlying volatility over the next several days could potentially jolt the strength of the broader bullish trend. Namely, the share price could very likely recoil from the resistance, and go on to establish a minor bearish correction before the uptrend can be resumed. The emerging setup can be utilised by bears and bulls alike, just in different ways.
Meanwhile, the consensus forecasts expect Morgan Stanley to report Earnings Per Share of $1.29. This exceeds slightly the $1.20 EPS that were delivered for the same period a year prior. Overall, if the bank's final performance meets the initial projections, this would likely be received as a success by traders and investors alike, given the persisting coronavirus fallout weighing down on the financial industry.
1. Long-Term Outlook:
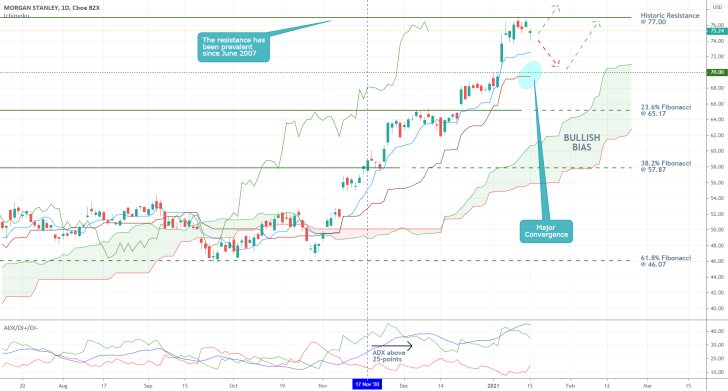
The historically significant resistance in question is positioned at the 77.00 level, as shown on the daily chart below. Notice that the price action has been consolidating just below the resistance for the past several trading days, but has been unable to break out above it.
This behaviour could be exhibitive of mounting bearish pressure as contrarian traders weigh in on a possible correction; however, this may not necessarily be the sole explanation of the price action's recent demeanour. The momentary range could result from market bulls waiting for the release of the earnings report before they resume inflating the bullish sentiment by adding to their buying orders.

The Ichimoku Cloud indicator highlights the very robust bullish bias in the market, which has been rising steadily over the past several weeks. Part of this is due to traders' new year's optimism, the effect of which we covered in our article on the impact of market seasonality.
The ADX indicator, too, represents the strength of the existing uptrend. As can be seen, the indicator crossed above the 25-point threshold on the 17th of November and has been strengthening ever since. Even though this reading alone does not necessarily preclude the possibility for the emergence of at least a minor bearish correction, the ostensibly bullish sentiment favours the continuation of the uptrend's development in the longer-term.
Speaking of the Ichimoku Cloud indicator, notice that its baseline (serving as a floating support in red) is currently converging towards the psychologically significant support at 70.00. At present, this level seems like the most plausible target for a potential correction, depending on the pullback's strength.
2. Short-Term Outlook:
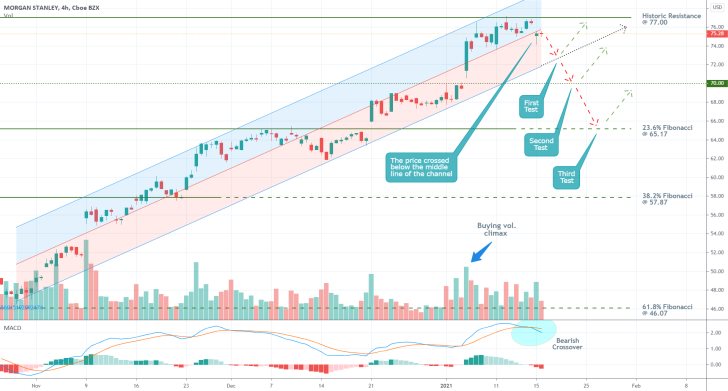
As can be seen on the 4H chart below, the price action has been advancing within the boundaries of a regression channel. It closed below the channel's middle line yesterday, just as it (the middle line) is nearing the historic resistance at 77.00. This behaviour could catalyse the next directional swing of the price action. In other words, if it remains concentrated in the lower portion of the channel, this would be likelier to result in a bearish correction.
A buying volume climax was already reached in early-January, which is inlined with the primary anticipations for a new dropdown. Meanwhile, the MACD indicator demonstrates that the underlying momentum has already started to turn bearish (bearish crossover), which could prompt more market bears to action.

Depending on the scope of the bearish commitment in the market, a potential correction could bottom out in one of three places. It could do so near the lower boundary of the regression channel; near the aforementioned psychological support at 70.00; or the 23.6 per cent Fibonacci retracement level at 65.17, which also has such psychological significance.
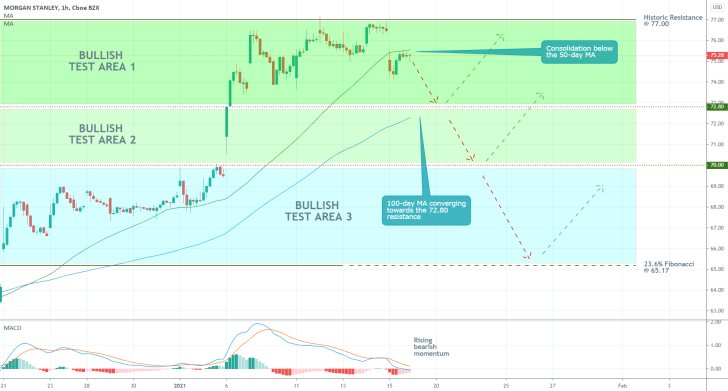
These scenarios outline the boundaries of three testing areas, as shown on the hourly chart below. Depending on how the market behaves next, the bears could utilise contrarian strategies to catch the anticipated dropdown in the short-run (it could reach either of the three areas' lower limits). Of course, that is if the market does not immediately resume heading north, bolstered by heightened optimism for tomorrow's earnings report.
In contrast, more risk-averse bulls could wait for the price action to bottom out either at 72.80, 70, or 65.17, before they utilise trend-continuation strategies. Essentially, they would be looking for an opportunity to catch the subsequent bullish rebound.

3. Concluding Remarks:
The latest market momentum is ostensibly bearish, as highlighted by the MACD indicator on the hourly chart below. Meanwhile, the price action remains concentrated between the 50-day M.A. (in green) and the 100-day M.A. (in blue). Both of these factors seem to be inlined with the expectations for a new bearish correction in the near future.
However, traders should be careful with the precision of their orders. Firstly, the above-mentioned expectations for an upsurge in volatility could very likely lead to adverse fluctuations, resulting in sub-optimal entries. This could be made worse by potential disparities in liquidity around the time of the earnings report's release.
Secondly, the anticipated pullback could be much smaller than some might expect. The 100-day M.A. is currently converging towards the 72.80 support, which could on its own prevent any deeper dives.

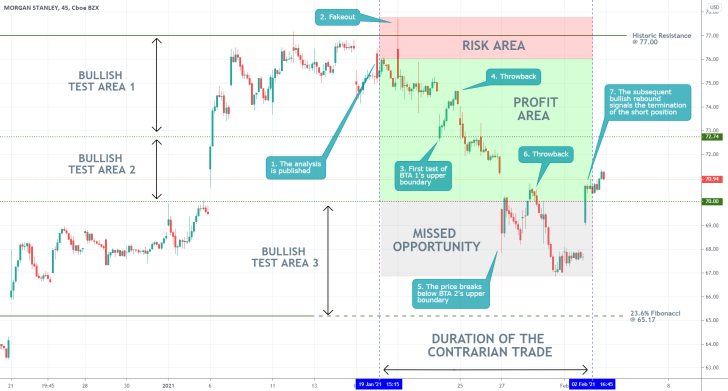
- Overall, the behaviour of the price action met the expectations of the analysis. Despite one fakeout above the historic resistance following the release of Morgan Stanley's Q4 earnings, the share price started falling.
- Notice that, however, the bearish correction did not reach the final target that was the 23.6 per cent Fibonacci. Yesterday's bullish rebound signals that the correction likely bottomed out, which is why the short position can now be closed.
- Contrarian traders need to be especially precise because they are essentially betting against an established trend. Hence, even the subtlest pieces of evidence pointing to a likely termination of an underlying correction should be taken as a potential threat to a contrarian trader's positions.
Disclaimer: Your capital is at risk! Trading and investing on the financial markets carries a significant risk of loss. Each material, shown on this website, is provided for educational purposes only. A perfect, 100% accurate method of analysis does not exist. If you make a decision to trade or invest, based on the information from this website, you will be doing it at your own risk. Under no circumstances is Trendsharks responsible for any capital losses or damages you might suffer, while using the company’s products and services. For more information read our Terms & Conditions and Risk Disclaimer.


