The analysis for today examines the price action of Merck & Co. The company is one of the largest pharmaceutical giants in the world, but its share price has remained somewhat undervalued in the recovery that followed the initial coronavirus fallout in Q1.
Special attention was given to the pharmaceuticals sector in the aftermath of the initial stock market crash, given the crucial role it is going to play in the struggle against the virus. From the ongoing vaccine research to the development of a treatment drug for COVID-19, pharmaceutical companies have been placed in the limelight in the fight against the coronavirus crisis.
Even still, Merck's share price did not gain considerable bullish momentum during these tumultuous times. Part of the explanation as to why this is the case stems from the fact that Merck & Co. does not participate actively in the R&D process of a SARS-Cov-2 vaccine, nor does it strive to develop a drug for treating COVID-19.
The company's stock has depreciated by 0.17 per cent in the last six months. Accordingly, the share price of Merck has advanced by 5.53 per cent in the previous three months and just 1.30 per cent over the last month. What these numbers imply is that the company's stock has barely managed to recover from the initial coronavirus hit, and has started gaining positive momentum only in the last several months.
This creates some interesting opportunities for position traders who can go long on Merck shares ahead of the next earnings report, which is due for release in early November. At present, the stock seems quite undervalued and poised to go up. Meanwhile, shorter-term traders should pay attention to the recent behaviour of the price action, as it nears several crucial test levels.
1. Long-Term Outlook:
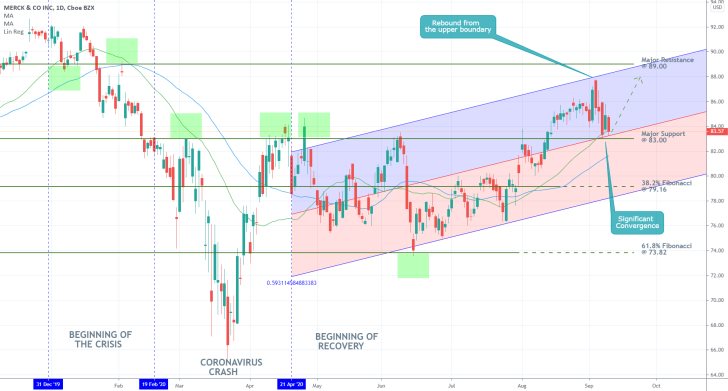
As can be seen on the daily chart below, Merck's stock price is currently converging towards several crucially important price levels and possible turning points. First of all, the price action appears to be consolidating just above the 30-day MA (in green), which serves the role of floating support. Hence, if the price does not break down below it in the next several trading days, the likelihood of a rebound would be increased significantly.
Secondly, the recent retracement was initiated after the price action neared the upper boundary of the regression channel, which took place several days ago. The price action is currently trading around the channel's middle line, which also acts as a floating support. This is the second potential turning point for the underlying price action, as the channel's central line is positioned close to the current market price.
Thirdly, both of these floating supports currently converge with the major support level at 83.00. The prominence of the latter has already been proven on several previous occasions. Given the fact that the price action is presently concentrated around these three supports, the termination of the current retracement and the establishment of a subsequent rebound towards the major resistance level at 89.00 seems to be the most likely outcome.

Notice also that the channel's lower boundary is currently nearing the 38.2 per cent Fibonacci retracement level at 79.16. Should the underlying sentiment turn noticeably bearish in the following days and the price action breaks down below the major support at 83.00, then the next most likely target would be precisely the 79.16 level. The latter bears psychological significance as well given its closeness to the 80.00 benchmark.
2. Short-Term Outlook:
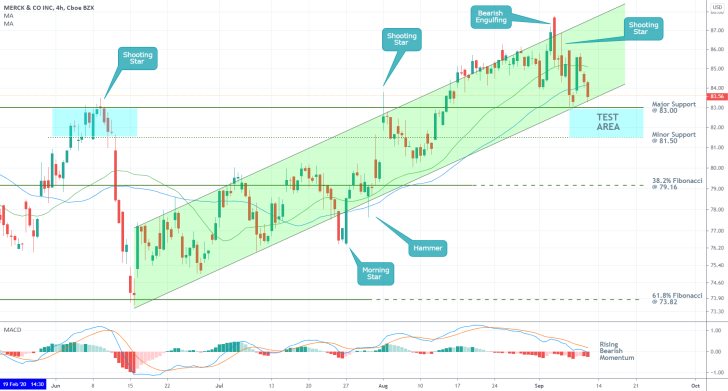
As can be seen on the 4H chart below, the price action is demonstrating mostly bearish behaviour in the short-term. The development of a bearish engulfing close to the upper boundary of the ascending channel and the subsequent appearance of a shooting star, both attest to the prevalence of short-term bearish bias. This is further confirmed by the fact that the price action broke down below the 50-day MA (in blue).
The prevalence of the immediate bearish sentiment in the market is going to be tested if the price falls to the blue area. The latter is positioned between the major support level at 83.00 and the minor support at 81.50. This is the area to which the price action could fall before a reversal occurs.
It is also worthwhile mentioning that the MACD indicator is currently signifying rising bearish momentum, which means that the bulls should be especially cautious not to enter the market long prematurely. Instead, they should be patient and wait for this bearish momentum to be exhausted before they bet on a bullish reversal.

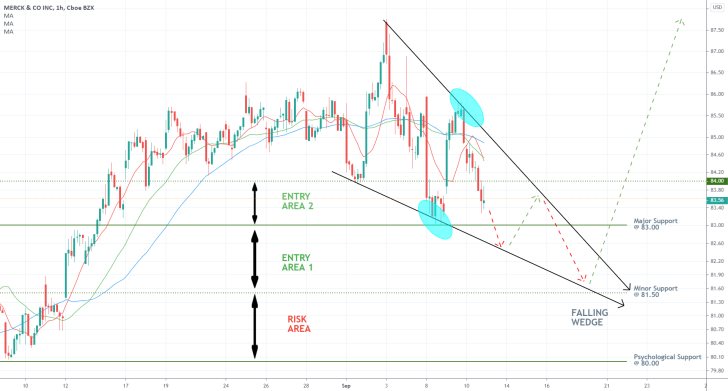
The hourly chart below illustrates one possibility in which this bearish momentum is likely to be exhausted. As can be seen, the price action is currently establishing a Falling Wedge pattern, which represents a temporary break in the development of a broader bullish trend. The price is likely to test the upper border of the wedge AT LEAST one more time before such a breakout occurs. Given the wedge's proximity to the major support level at 83.00, one such breakout is likely to take place close to set support.
Contrarian traders could exploit the current short-term opportunity by selling the stock as the retracement continues to unfold. However, this strategy entails a huge degree of risk due to the aforementioned convergence of prominent supports on the daily chart above.
Meanwhile, position traders could take advantage of the stock's inherent value and bet on its probable future appreciation as the next earnings call date (early November) comes closer. As was mentioned above, they would do well to wait for the termination of the bearish sentiment before they go long. Two entry areas can be utilised by such traders, depending on their degree of risk aversion.

3. Concluding Remarks:
Merck's share price looks poised to go higher in the near future; however, at present, the stock seems mostly driven by bearish pressures. Hence, bulls should remain cautious and patient and continue observing the behaviour of the share price as it comes closer to the aforementioned cluster of prominent supports.

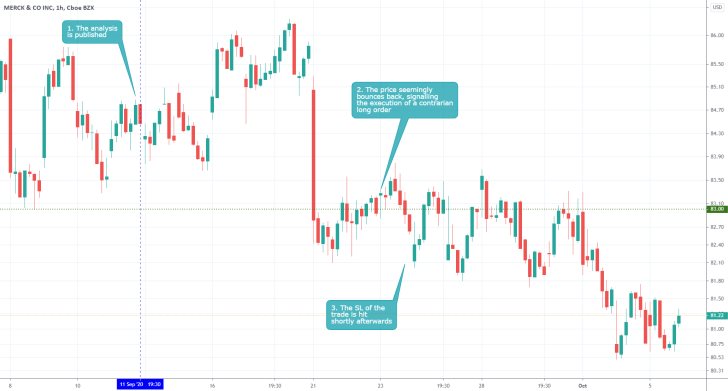
- The longer-term anticipations of the analysis were quite inaccurate, because the price action did not finish developing the falling wedge pattern, which was the basis of the entire analysis. Traders should remember that it is risky to build their forecasts of future price action based on unfinished patterns.
- Meanwhile, the shorter-term expectations of the analysis were more accurate, as the bearish pressures did indeed dominate the price action shortly after the publication of the analysis.
Disclaimer: Your capital is at risk! Trading and investing on the financial markets carries a significant risk of loss. Each material, shown on this website, is provided for educational purposes only. A perfect, 100% accurate method of analysis does not exist. If you make a decision to trade or invest, based on the information from this website, you will be doing it at your own risk. Under no circumstances is Trendsharks responsible for any capital losses or damages you might suffer, while using the company’s products and services. For more information read our Terms & Conditions and Risk Disclaimer.


