The market has now had some time to price in the tempestuous employment data in the US and Canada from last week, which has jolted the short term price action on the USDCAD at the end of last Friday's trading session. At present, the pair's price action appears to be subdued, with the underlying market pressures being slightly tilted to the downside.
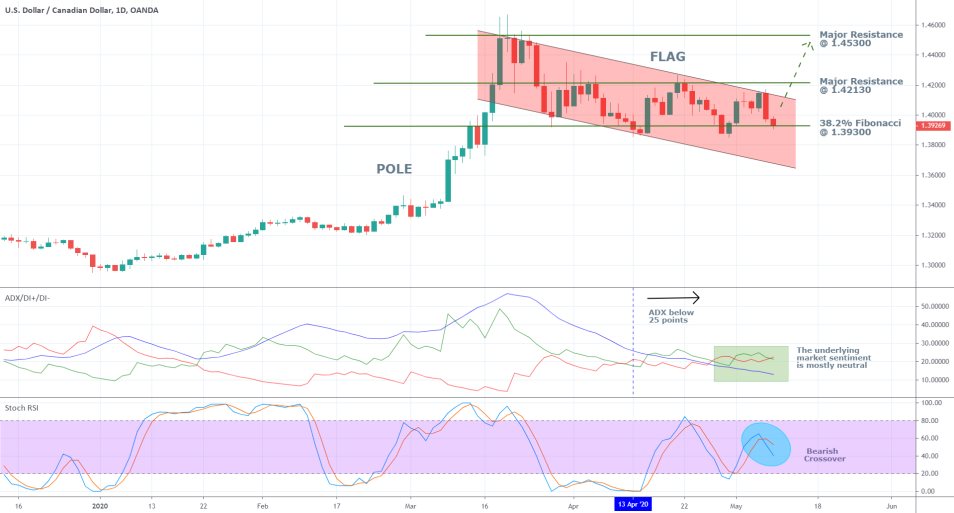
The price action continues to head further south at a moderate pace while being contained within the boundaries of a downwards sloping channel. This, in turn, is a behaviour that can be understood as potentially signalling the formation of a classic bullish flag pattern.
If the market is indeed undergoing the process of establishing such a trend continuation pattern, then this would open up some excellent trading opportunities for market bulls, who can enter long at a discount towards the perceived swing low's bottom.
That is why the purpose of today's analysis is to examine the underlying price action and to discern whether or not the USDCAD is indeed currently forming a bullish flag pattern. If it is determined that it is, then the analysis is going to outline the most likely future behaviour of the USDCAD's price action, and therefore the most advantageous entry levels into the market.
1. Long Term Outlook:
As can be seen on the daily chart below, the price action is contained within the boundaries of the aforementioned downwards-sloping channel (represented in red), but also within the boundaries of a horizontal range. The latter has the major resistance level at 1.42130 serving as its upper limit, and the 38.2 per cent Fibonacci retracement level at 1.39300 serving as its lower limit.
Therefore, any breakout above the channel's upper boundary and the range's upper limit is going to represent a strong indication of mounting bullish sentiment in the market, and thereby a confirmation of the bullish trend's continuation. Conversely, a breakdown below the range and channel's two respective lower limits is going to be signifying the opposite – that the market has stopped establishing a bullish flag pattern, and that the underlying sentiment has turned ostensibly bearish.

Notice that there are three distinct points of contact between the price action and the channel's upper boundary. In contrast, the USDCAD's price has fallen to the channel's lower edge only on two occasions. This entails that the price action can fall below the 38.2 per cent Fibonacci retracement level to the channel's lower boundary before it bounces back. Consequently, a new swing low may need to develop before the broader bullish trend can be resumed. Therefore, traders should not rush to enter long right away on the expectation that the underlying price action would break out sooner or later.
The ADX is currently threading below 25 points, which is to be expected given the narrow consolidation of the price action just above the major support level at 1.39300, which coincides with the 38.2 per cent Fibonacci retracement level. Additionally, the ADX has converged towards the DI+ and the DI-, which manifests the indecisiveness of the underlying market pressures at present, but also is a behaviour that typically occurs prior to the formation of a major breakout/breakdown. This behaviour is therefore inlined with the previous assertions regarding the anticipation for the broader bullish trend's continuation.
The Stochastic RSI, too, currently finds itself in the middle ground between the 'Overbought' and the 'Oversold' extremes, which underscores the relative equilibrium between the underlying market pressures, and therefore supports the existence of the current range-trading environment. Market bulls would be watching for a new crossover on the RSI, which would underpin a likely surge in the underlying buying pressure. This, in turn, is needed for the continuation of the bullish flag pattern's development.
2. Short Term Outlook:

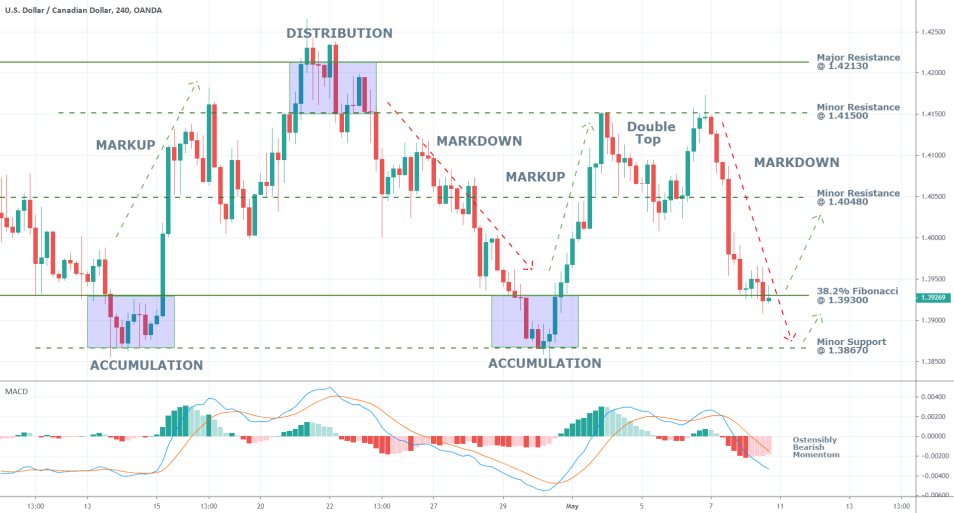
As can be seen on the 4H chart above, the price action has recently established a Double Top pattern, which has an inherent bearish inclination. The subsequent dropdown has reached the aforementioned 38.2 per cent Fibonacci retracement, but the price action is quite likely to continue heading even lower before it finds the necessary support.
This could happen at the minor support level at 1.38670, which has already served as a turning point for the underlying direction of the price action on two separate occasions. As can be seen, this level has acted as a lower boundary for the two preceding Accumulation ranges, which confirms its significance.
It should be noted that the MACD is currently elucidating an ostensibly bearish momentum in the market, which should deter bulls from entering long in the market prematurely. In other words, traders who want to execute long orders on the USDCAD need to wait for the termination of the current downswing before they can enter the market at a discount and on the anticipation for the continuation of the bullish flag pattern's development.
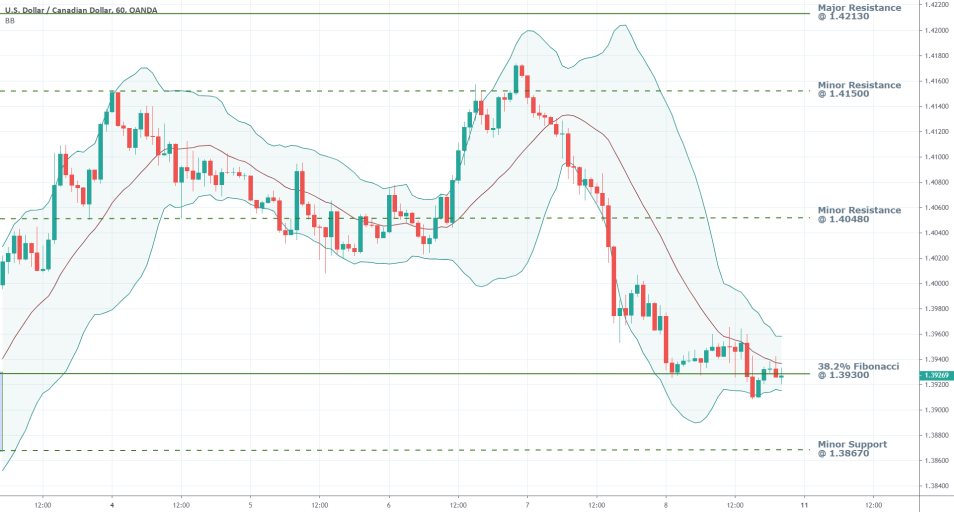
The Bollinger Bands on the hourly chart below are becoming increasingly narrower, which indicates the falling levels of adverse volatility in the market, and is something that is to be expected in range-trading environments. The simultaneous consolidation of the price action around the 38.2 per cent Fibonacci retracement level and the ongoing contraction of the BB could be perceived as a likely transitionary stage in the market.
The recent downswing could be exhausting its strength (note that's not to say its wholly completed!), and the price action could, therefore, be preparing for the formation of a new directional swing.

3. Concluding Remarks:
Most of the underlying evidence presented in this analysis is indeed congruent with the anticipation for the formation of a bullish flag pattern. This would benefit the utilization of trend continuation trading strategies by market bulls. A breakout above the major resistance level at 1.42130 is going to represent the most significant confirmation of these expectations.
Nevertheless, traders should be cautious as there is also compelling data signalling the likely continuation of the current downswing's development before the market gets ready to bounce back up into positive territory.

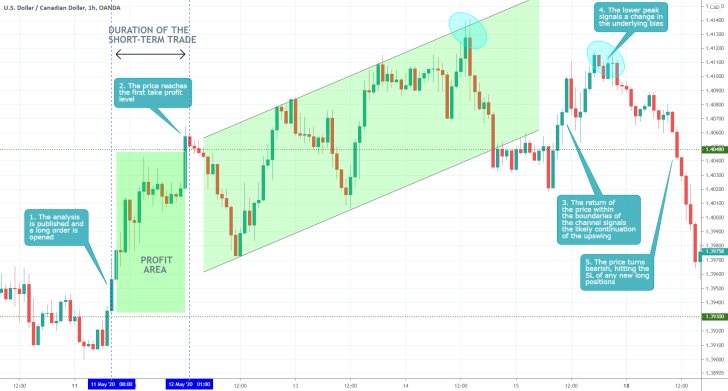
- The longer-term expectations of the analysis for the formation of a Bullish Flag pattern were not realised, however, its short-term projections were realised. Sometimes the underlying market sentiment changes while the trade unfolds, and that is normal. The trader should not be angry for not being able to see this change ahead of time, but instead, he or she needs to keep an open-mind in order to spot the subtle pieces of evidence signalling the emergence of such changes as they unfold.
Disclaimer: Your capital is at risk! Trading and investing on the financial markets carries a significant risk of loss. Each material, shown on this website, is provided for educational purposes only. A perfect, 100% accurate method of analysis does not exist. If you make a decision to trade or invest, based on the information from this website, you will be doing it at your own risk. Under no circumstances is Trendsharks responsible for any capital losses or damages you might suffer, while using the company’s products and services. For more information read our Terms & Conditions and Risk Disclaimer.


