Over the past several weeks, gold, which is arguably the most popular safe-haven asset in the world, has undergone through a remarkable surge in volatility due to the underlying changes in demand for the precious commodity. Its price has risen in line with the exponentially increasing uncertainty from the coronavirus pandemic, which continues to plague the global capital markets.
Since the beginning of the market rout in mid-February, investors have flooded the market for gold, seeking to hedge their risks from the global uncertainty by moving their capitals into gold. The massive surge in demand has resulted in the price of gold appreciating by more than 140 points in several weeks to around 1750 per troy ounce, with some market experts starting to forecast future rallies to 2000 or even as far as 3000 dollars per troy ounce.
Making such bets is actually easier than one might think – the word 'bet' is crucially important here - due to the massive underlying volatility that continues to affect gold's price action. With such colossal volatility outbursts, it's anybody's guess as to how far the gold's rally can continue as the coronavirus crisis continues to develop. In reality, nobody can be certain as to when the global conditions would stabilise, consequently lessening the adverse impact of the aforementioned uncertainty on the global economy. In that sense, projecting how much further north the price of gold can continue climbing is tantamount to guessing on which precise date in the future the pandemic would be over.
What one can do, however, is to observe the nature and structure of the broader bullish trend, which was initiated prior to the novel coronavirus' global outbreak. The recent rally, which, as was shown above, is due to the significant panic amongst investors worldwide. In that sense, the contemporary situation is contributing to the development of an existing bullish trend, but it is not its prime cause. The difference between the two is of crucial importance.
It could be that the existing bullish trend might have already been running out of steam prior to the recent rally's initiation, in which case the 140 points jump would be driven purely on external pressures in an otherwise waning trend. In other words, in order to contextualise the nature and scope of the recent rally, so that one can make projections of additional 300+ hikes in the near future, one has to understand the nature of the existing trend. Moreover, one has to be able to know whether the recent developments have added to the strength of the current trend, or the price action is currently being driven purely on speculation.
That is why the current analysis delves into the question at hand and provides a detailed technical examination of the price action's behaviour. The analysis is going to focus mostly on the technical aspect of gold, with the most important fundamental factors being explained in the context of the technical analysis.
1. Long Term Outlook:
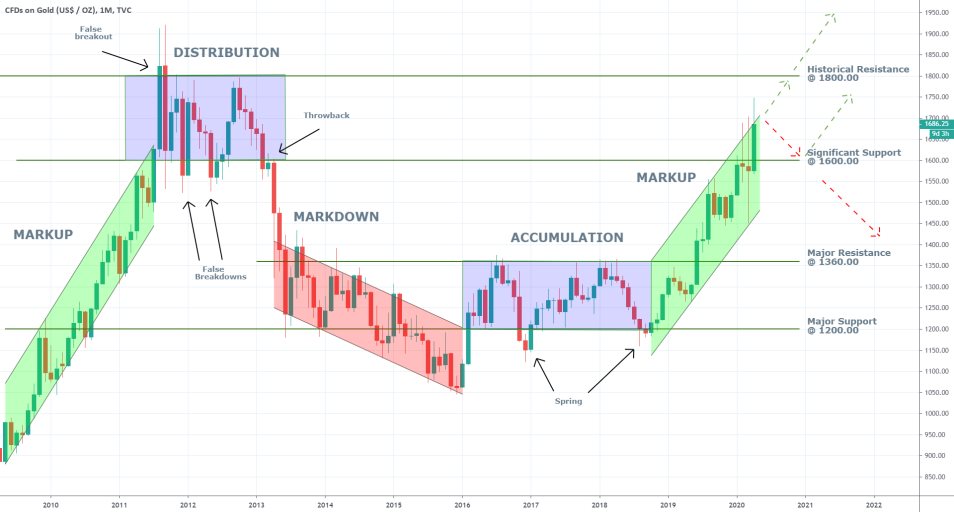
As can be seen on the monthly chart below, the most recent bullish trend is a relatively new development, compared to the previous bullish trend, which took far longer to be fully established. This is a minor reason to anticipate the continuation of the price action heading further north, but it should not be taken as a trading signal at face value.
Looking at the candlesticks representing the two previous months, it can be seen that they have very small bodies and massive upper and lower shadows. This behaviour is typical whenever the price action has to test the strength of a crucial price level; in this case, the significant support (previously resistance) level at 1600.
The price action dropped to the ascending channel's lower boundary in March before rebounding back up (the ascending channel roughly outlines the limits of the currently evolving bullish trend). It found strong support there, which helped the eventual break out above the 1600.00 level in April. This is a solid indication of rising bullish commitment in the market, and it does indeed support the projections of long-term bullish price action.
The price action is currently struggling with breaking out above the ascending channel's upper boundary, which acts as a resistance level. If April concludes with the price action trading around 1680-1700, this would mean that the bullish momentum has been contained at least for the time being, consequently increasing the likelihood for the formation of a minor bearish correction to the significant support level at 1600.
Given the overall monthly outlook, two possible scenarios seem like the most probable future developments. Either the aforementioned spike of bullish commitment is strong enough to continue driving the price action higher so that it can test breaking out above the historical resistance level at 1800, or an intermediate correction to 1600 is needed before the bullish trend can resume going north towards the historical resistance.
In the latter case, if the price action does indeed fall back to the significant support level at 1600, this could potentially indicate rapid exhaustion of the market's bullish commitment. If the price of gold subsequently breaks down below 1600, this could be interpreted as signalling the end of the bullish pressures' prevalence in the market, and potentially as being the initial stage in the development of a new dropdown. In this case, the massive Marabozu candlestick representing April's price action would turn out to be a false breakout. Hence, the price action should be closely monitored if it does indeed fall back to the significant support level at 1600.
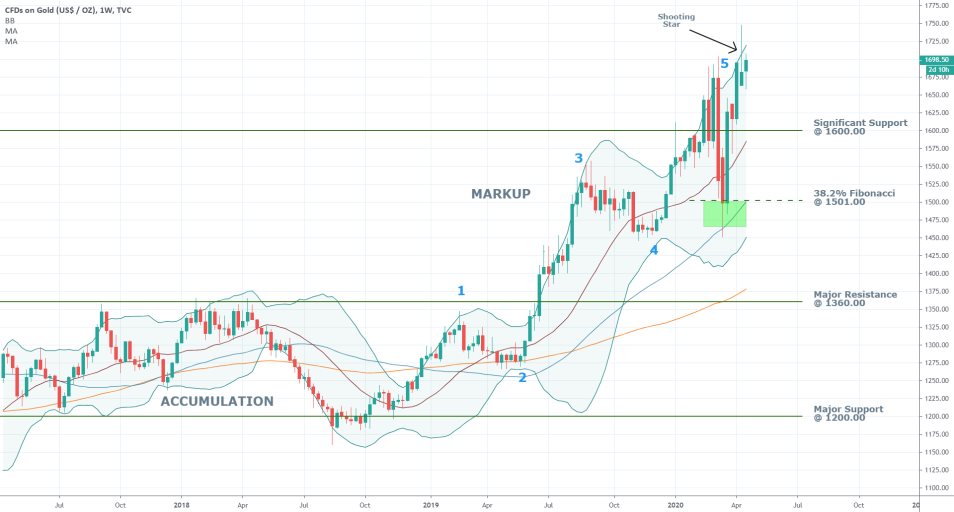
As can be seen on the weekly chart below, the price action is evolving in a distinct 1-5 impulse wave pattern, postulated by Elliott Wave Theory. The pattern might have already been completed, provided that the peak at 5 has indeed been established last week. However, the pattern's final impulse leg might be still developing, in which case the peak at 5 could be positioned higher.
Essentially, the termination of the 1-5 impulse wave pattern would indeed entail the completion of the bullish trend. Afterwards, the market could form a new Distribution range followed by a Markdown, or it could consolidate for a little while before continuing to rise higher. The ultimate direction would depend on the further development of the coronavirus situation.
While it is true that the market can indeed go in either direction, what can be stated confidently is that going long in an almost exhausted 1-5 bullish wave pattern would be unwise (for longer-term trades).
On the other hand, the perfect ascending order of the three Moving Averages – the 200-day MA, the 150-day MA, and the 100-day MA – in addition to the clear and decisive rebound from the 38.2 per cent Fibonacci retracement level at 1501.00, are both major indications of the bullish strength's prevalence in the market.
Nevertheless, these are both indications that would take a long time to register a change in the market sentiment. Consequently, even if the bears have already taken back control, the available indications would not have picked that up. For instance, last week's price action has resulted in the creation of a 'Shooting Star', which is a candlestick commonly found at the top of bullish trends. It indicates potential reversals in the direction of the price action, which in the current context could imply at the very least a forthcoming correction back to the significant support level at 1600.
As regards the fundamental aspect of the market, it should be acknowledged that global coronavirus cases have reached a sort of a plateau, which is an early confirmation of the worldwide effort of curbing the spread of the deadly pathogen's effectiveness. In other words, the pandemic is far from being curtailed, but there are now definite signs of reversing the rate of its spread. This has prompted countries like Germany, the US, Austria, Japan, and others, to draw out plans for reopening their economies. This would ease off global tensions and mitigate the aforementioned uncertainty in the market, likely diminishing the demand for gold as a consequence.
Unsurprisingly, countries that are preparing to reopen their economies have already spent billions of dollars in relief packages to cushion the extent of the economic hit from the fallout. According to the IMF cited by Bloomberg, the US, Germany, and Japan have each pumped over $1 trillion since the beginning of the crisis. Countries like Spain, Italy, the UK, France, Brazil, Canada, and China, have jointly injected over $3 trillion as well. All of this liquidity is meant to support the economic activity while the international lockdowns are in effect. As the impact of this unprecedented liquidity starts to take shape, the scope and size of the brewing recession are at the very least going to be lessened during Q1 2020, with anticipations for a recovery by the end of the year and into 2021. All of this means that the demand for gold is likely to stem once the relief from the extra liquidity starts to be felt in the global economy.
2. Short Term Outlook:
As can be seen on the daily chart below, the ADX has only recently risen above 25 points, which means that the current bullish sentiment in the market could be here to stay.
The prompt reversal above the 38.2 per cent Fibonacci retracement level underpins the existence of the aforementioned volatility in the market. This uncharacteristic and sharp reversal in the direction of the price action is illustrative of massive price speculation currently taking place. Such market behaviour is ideal for the formation of intermittent price fluctuations, possibly quite big ones; however, it does not typically support the creation of massive long term trends. In other words, long term bulls should be cautious of the current sporadic behaviour of the price action.
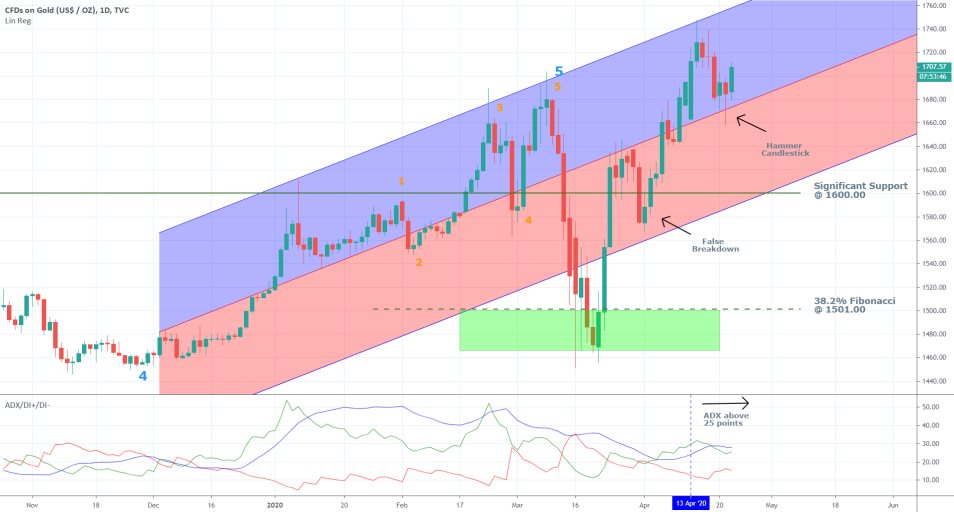
Nevertheless, the false breakdown below the significant support level at 1600 and the hammer candlestick with its lower shadow touching just below the regression channel's middle line, are two distinct indications of existing bullish commitment in the market. Essentially, the current bullish trend is demonstrating signs of its development's likely continuation in the near future; however, the trend's strength is not decisive, and it could already be depreciating.
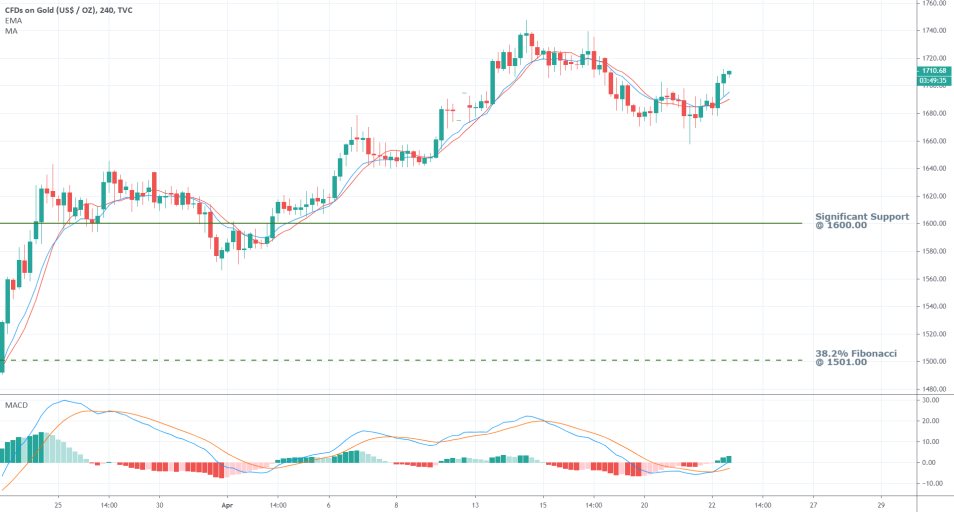
Finally, the 4H chart below illustrates the rising bullish momentum in the short term. The recent crossover on the MACD indicates the change in the market momentum's prevalence.
Additionally, the 10-day EMA has crossed above the 10-day MA as the price continues heading higher, which underpins the impact of this bullish momentum on the price action. The price action is likely to continue heading north in the immediate future until it reaches once again the recent top at around 1740, which is going to be the most important test for the short term bullish momentum's strength.
3. Concluding Remarks:
The price of gold is currently trading in a massive bullish trend, which could continue rising higher in the next few months. However, there are reasons to anticipate waning bullish commitment in the market as the coronavirus situation continues to evolve. Blindly entering the market long at the current rate is going to be a mistake, as the price action might be due for establishing a bearish correction.
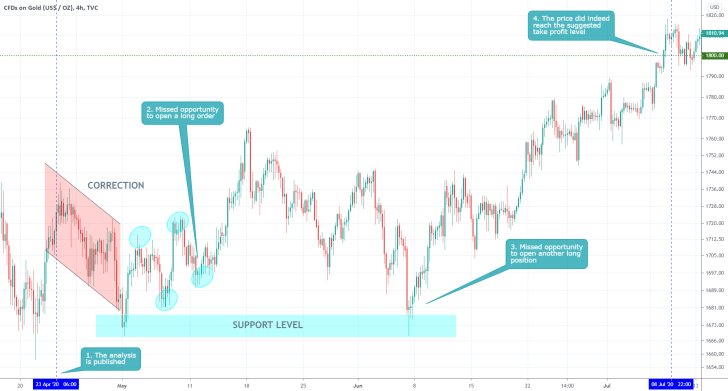
- This analysis represents one of these rare occasions in which both the short-term and long-term expectations were realised, and yet, no profits were made. A bearish correction did appear shortly after the publication of the analysis, and the price of gold did indeed continue to climb in the mid-term. That is so because of the massive amounts of uncertainty in the market at that time. With proper follow-ups, there are several developments that could have been better-utilised as they occurred. The big takeaway here is that when the market is quite volatile and uncertainty drives the prices, it is better to draw narrower levels of support and resistance in order to target smaller directional swings.
Disclaimer: Your capital is at risk! Trading and investing on the financial markets carries a significant risk of loss. Each material, shown on this website, is provided for educational purposes only. A perfect, 100% accurate method of analysis does not exist. If you make a decision to trade or invest, based on the information from this website, you will be doing it at your own risk. Under no circumstances is Trendsharks responsible for any capital losses or damages you might suffer, while using the company’s products and services. For more information read our Terms & Conditions and Risk Disclaimer.


