Looking back at some of our most recent analyses that were published last week, the continually evolving coronavirus situation on the global markets appears to be preparing to enter into its next developmental stage. Our examinations of the French CAC 40 index, wheat and the USDCHF pair, all seem to outline several distinctive stages that were present in the commodities, FX, stocks and other markets.
The initial market crash was followed by a bullish snap correction, which is presently morphing into a consolidation range. Naturally, this consolidation range can either be followed by a renewed bullish trend or by a new markdown.
For today's analysis, we have selected Morgan Stanley's share price, which finds itself in a similar situation. A detailed examination of the price action's behaviour around the edges of the underlying range is going to shed more light on the next most likely developmental stage.
Being a multinational investment bank, Morgan Stanley represents one of Wall Street's flagships, which makes it of prime importance for the stock market as a whole. Any observed patterns on its share price are likely to appear to some degree in the underlying price actions of other companies in the financial sphere, which is why Morgan Stanley's shares can be used as a gauge for the broader stock market. This underlines the importance of today's analysis.
1. Long-Term Outlook:
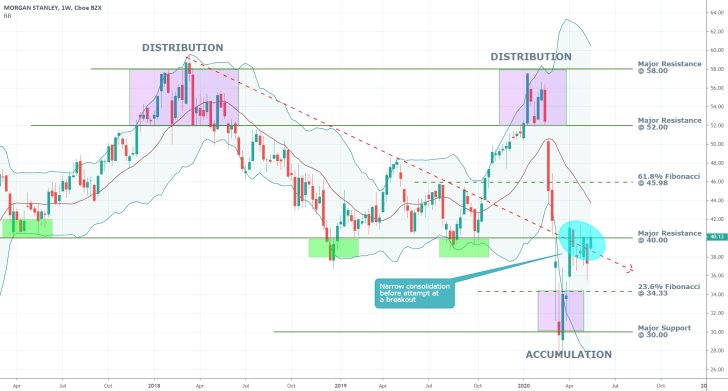
As can be seen on the weekly chart below, the underlying price action has been consolidating just below the major resistance level at 40.00 for over a month and a half now, which underscores the prominence of set level. Moreover, this particular price level has also served as significant support in the past, having managed to contain the price action above it on three separate occasions (highlighted by the three green rectangles).
The only time that the 40.00 keystone level was completely broken was during the initial coronavirus market crash. This goes to show the level's significance as a prominent turning point for the underlying direction of the price action. In other words, the 40.00 resistance level represents a major obstacle for the current bullish correction, which has already morphed into a consolidation range with the resistance level being its upper boundary.

The market bulls would interpret any potential breakout above the resistance as an indication of even more substantial bullish commitment in the market, likely resulting in the execution of even more buying orders above 40.00.
Conversely, the market bears would be looking for signs of exhaustion in the underlying bullish sentiment. If the price action continues to consolidate below the major resistance level without succeeding in definitively breaking out above it, this could be interpreted as a sign of exhaustion. Consequently, the major resistance level can once again turn into a significant turning point for the direction of the price action, and the bears can contribute to this by executing even more short orders on the anticipation for a trend reversal.
All of this underpins the importance of the price action's immediate behaviour around the 40.00 resistance level, which could have profound consequences for the longer-term future of Morgan Stanley's share price.
The most substantial bullish confirmation is the fact that the price action has managed to break out above the downwards sloping trend line (in red), which means that it could be gearing up for an attempt at a decisive breakout above the 40.00 resistance level.
If this succeeds, the next target for the renewed bullish trend would be the 61.8 per cent Fibonacci retracement level at 45.98. Conversely, a failed breakout could turn into a new major dropdown to the 23.6 per cent Fibonacci retracement level at 34.33. The latter's importance has already been confirmed by the fact it served as an upper boundary for the last Accumulation range.
2. Short-Term Outlook:

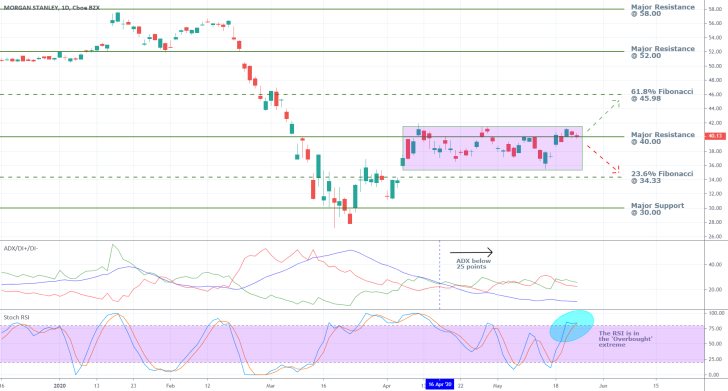
The purple rectangle on the daily chart above encompasses the boundaries of the aforementioned range. As can be further seen, the price action is currently attempting to conclude establishing a breakout above the 40.00 level for the third consecutive time. Whether or not this turns out to be another failed attempt at doing so is going to be hugely dependent upon the underlying market pressures.
The ADX has been threading below 25 points since the 16th of April, which underlines the robustness of the underlying range. Because of that, any successful breakout or breakdown outside of the range's boundaries is going to require considerable strength and commitment. Judging by the shape of the price action that has been observed over the last few days, such a decisive commitment appears to be lacking. In other words, it seems as though the recent breakout is probably going to turn into another failed attempt.
These assertions are somewhat confirmed by the Stochastic RSI, which has recently entered into the 'Overbought' extreme. While this does not necessarily mean that the underlying buying pressure has reached its full potential at present, it could prompt adverse trading given the underlying range-trading conditions. Most swing traders tend to sell when the underlying price action reaches the upper boundary of an existing range, or to buy when it reaches the range's lower boundary. If this were to happen now, then the newly executed trading volumes could tip the balance and cause the price action to change its direction yet again.
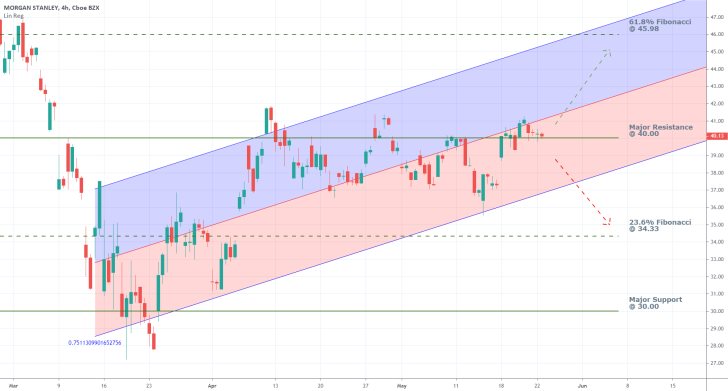
As can be seen on the 4H chart below, the price action has indeed managed to temporarily (at least for now) break out above the major resistance level at 40.00, but it remains trading below the ascending channel's middle line. For as long as this continues to be the case, the underlying bullish commitment in the market would continue to be somewhat subdued. Moreover, this would also favour the establishment of yet another reversal towards the channel's lower boundary.
Meanwhile, a breakout above the channel's middle line would confirm the strength of the underlying bullish commitment, which would be needed for future gains further north. The channel's upper boundary has recently surpassed the 63.8 per cent Fibonacci retracement level, which would make a potential breakout above it even more difficult.

3. Concluding Remarks:
Overall, Morgan Stanley's share price continues to be trading very close to the crucially important resistance level at 40.00, which makes it difficult to project whether or not the broader bullish correction would continue its establishment. A definitive breakout or downswing is needed before more comprehensive projections can be made of the price action's longer-term behaviour.
In the short run, it looks as though the underlying range is likely to persist in the immediate future.

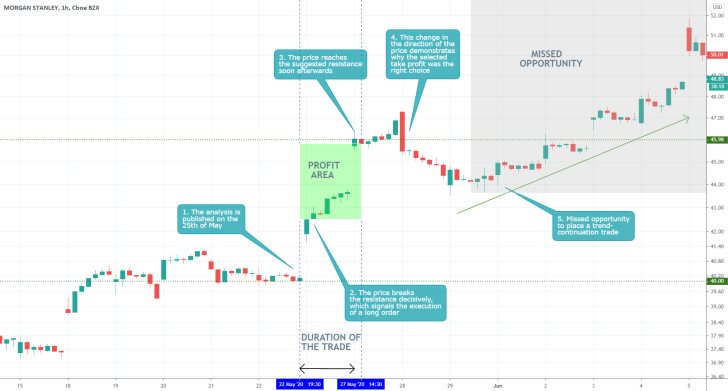
- The most important feature of the analysis was its suggestion that a definitive breakdown/breakout away from the 40.00 level would be needed to determine the next likely direction of the price. Nevertheless, the short-term expectations for the continuation of the range-trading conditions were proven wrong.
- When the market opened with a massive gap the next day, this was the definitive piece of evidence that signalled the need for the execution of a long order. A trend-continuation trade could have been opened at the bottom of the bearish correction.
Disclaimer: Your capital is at risk! Trading and investing on the financial markets carries a significant risk of loss. Each material, shown on this website, is provided for educational purposes only. A perfect, 100% accurate method of analysis does not exist. If you make a decision to trade or invest, based on the information from this website, you will be doing it at your own risk. Under no circumstances is Trendsharks responsible for any capital losses or damages you might suffer, while using the company’s products and services. For more information read our Terms & Conditions and Risk Disclaimer.


