The German DAX index rallied after the European open earlier today on renewed investors' enthusiasm from the upcoming Jackson Hole symposium in Wyoming. As central bankers, finance ministers, academics, and other financial market participants gather to discuss the prospects for recovery of the global economy, traders and investors would be looking for hints from the symposium regarding the future of the stock market rally.
The index advanced by more than 2.40 per cent so far during today's trading session, yet, this could turn out to be a short-lived hike. The threat from the coronavirus epidemic persistently weighs down on the German economic outlook. A recent resurgence in the number of confirmed cases signifies the danger from the necessary reintroduction of stricter containment measures.
Such a turn of events would undoubtedly hurt the still reeling German economy, which registered a massive slump in its industrial activity just last week. The downbeat Services and Manufacturing PMI data for August could signify the early stages in the development of a new economic contraction, in what looks increasingly like the middle part of a double-dip (W-shaped) road to recovery. If the latter is indeed the case, then the biggest economy in the Eurozone could register a new dive in the third quarter.
With all of that in mind, the price action of the DAX is likely to experience heightened volatility over the next several days, peaking around Thursday and Friday around the time of the Jackson Hole symposium.
1. Long-Term Outlook:
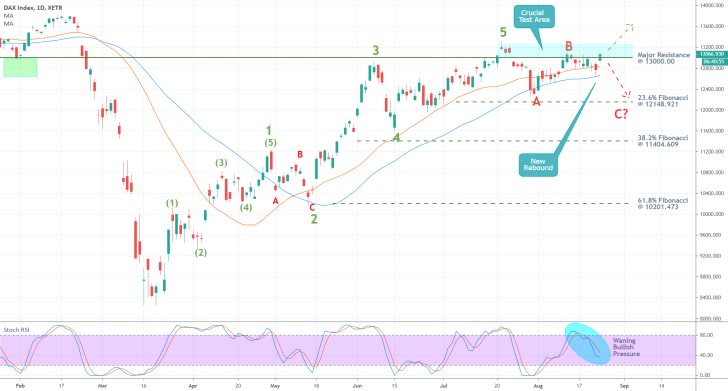
The remarkable, bullish rally, which was initiated in the aftermath of the initial coronavirus slump, can be examined using the Elliott Wave Theory. As can be seen on the daily chart below, a bullish 1-5 impulse wave pattern appears to have been terminated recently around the psychologically important resistance level at 13000.000. Subsequently, an inherently corrective ABC pattern started emerging around the same level, which encompasses the primary reason as to why a new bearish correction could appear from the current market price.
In other words, another impulse leg (B-C) is likely to be developed next, likely driving the price action below the dip at point A. The latter unsurprisingly took place around the 23.6 per cent Fibonacci retracement level at 12148.921, which also bares psychological significance.
For the time being, however, the DAX continues to consolidate around the aforementioned resistance in light of today's attempt at forming a new breakout above it.

The sudden rebound of the price action from the 50-day MA (in blue) on Friday signifies heightened bullish pressure in the short-term (potentially being caused by the aforementioned investors' enthusiasm). Depending on the scope of this bullish commitment in the market, the price action could attempt to continue advancing further north and penetrate the crucially important test area (in blue).
The strength of the bullish commitment in the market is underlined by the two rising moving averages and the fact that the 30-day MA (in green) resumes trading above the 50-day MA. No major bearish corrections could unfold while this relationship remains unbroken.
Conversely, there is also evidence to the contrary. The price action has already failed to break out above the major resistance level on two separate occasions resulting in temporary reversals, which increases the likelihood of this happening a third time.
Furthermore, the Stochastic RSI indicator demonstrates rising selling pressure in the market, which represents a favourable prerequisite for the development of a new price reversal.
2. Short-Term Outlook:
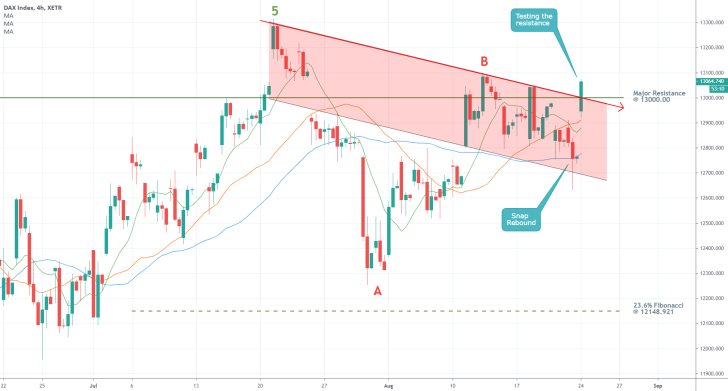
As can be seen on the 4H chart below, Friday's rebound resulted in the establishment of a hammer candlestick, which typically entails rising bullish sentiment. Moreover, the rebound occurred from the 50-day MA, which is also illustrative of strong support there. The price action tested the area below the moving average and below the downwards sloping channel for a little while but failed to close there.
Subsequently, the DAX jumped above the upper limit of the channel and above the major resistance level at 13000.000. The price action is currently nearing the peak at point B, and the area just above it has remained unbroken for a little over a month now. All of these factors could contribute to the establishment of a new reversal.

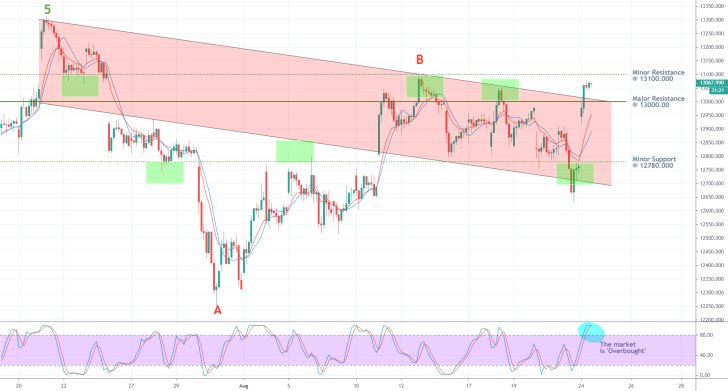
As regards the outlook in the very short-term, the price action remains contained within the boundaries of a minor range. The latter has the minor resistance level at 13100.000 as its upper boundary and the minor support level at 12780.000 as its lower boundary.
The price action is likely to rebound from the upper limit of the range due to the psychological significance of the major resistance at 13000.000 coupled with the fact that the market appears to be overbought at present. The last observation is made using the Stochastic RSI indicator once again.
Nevertheless, the price action remains concentrated above the 10-day EMA (in red), which is positioned above the 10-day MA (this time in blue). This relationship entails the current bullish outlook in the market, which is about to be tested.

3. Concluding Remarks:
The DAX is no longer demonstrating the same bullish commitment as the one that drove the recent rally. In fact, the price action is currently trading above the major resistance at 13000.000, but there is mounting evidence signalling a likely reversal.
The Jackson Hole symposium this week would probably stir heightened volatility on the index by the end of the week, likely prompting the formation of a new directional swing.
Overall, there are mixed signals at present, which means that the DAX could go in either direction. That is why it would be most prudent for traders to wait for more definitive pieces of evidence to become available so that they can then compare the new data against the current signals.

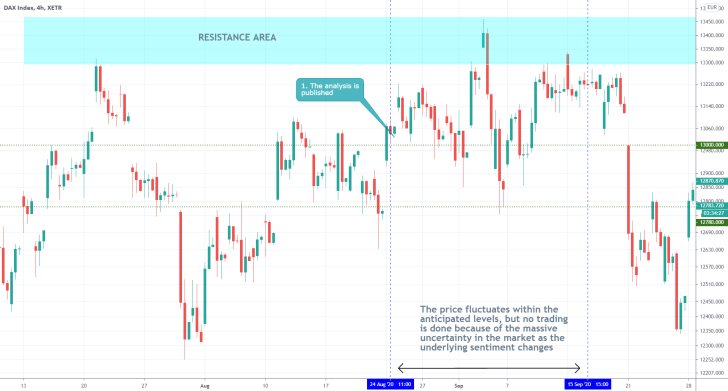
- The analysis successfully interpreted the changing market sentiment – from being ostensibly bullish into becoming more bearishly-oriented. The best aspect of the analysis was its evaluation of the underlying risks in the market at that time. Chiefly, the massive amounts of adverse volatility that made the price action quite unpredictable. When the market is behaving erratically it is better to refrain from trading, even if the price action fluctuates within the anticipated range levels.
Disclaimer: Your capital is at risk! Trading and investing on the financial markets carries a significant risk of loss. Each material, shown on this website, is provided for educational purposes only. A perfect, 100% accurate method of analysis does not exist. If you make a decision to trade or invest, based on the information from this website, you will be doing it at your own risk. Under no circumstances is Trendsharks responsible for any capital losses or damages you might suffer, while using the company’s products and services. For more information read our Terms & Conditions and Risk Disclaimer.


