As we have already argued on several occasions, the coronavirus crisis is entering into a new stage of its development. The market is transitioning from the volatile and unpredictable early days of the crash into a more tamed and relaxed form. This transition has subsequently prompted many financial instruments across multiple asset classes to form major consolidation ranges, as the underlying price actions become increasingly subdued.
This, however, has not been explicitly the case with all financial instruments. The USDCAD has been falling for the last several days, despite its price action not being ostensibly volatile. This, in turn, only gives the illusion that the USDCAD has been range-trading as well, but on a much larger scale.
As we argued yesterday, the greenback has been strained due to the unfavourable economic developments in the US. This tendency is likely to persist for as long as the coronavirus fallout continues to weigh down on the general economic activity in the states.
Meanwhile, the Loonie, too, is going to be affected by adverse data later today. The government is scheduled to release crucial GDP data reflecting on the size of the economic hit during Q1, which the consensus forecasts project to reach 9 per cent.
With such dismal outlooks for both currencies, the purpose of today's analysis is to determine whether or not the USDCAD has the potential to develop a new major bearish trend, seeing as how the price action has already reached a crucial junction and a potential turning point, or the pair would instead return to undecided range-trading.
1. Long-Term Outlook:
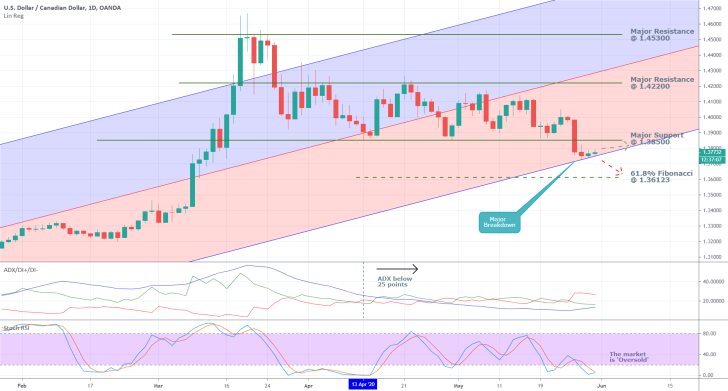
As can be seen on the daily chart below, the USDCAD has been exhibiting the aforementioned characteristics by range-trading since early April. The price action has been contained within the boundaries of a broad range with an upper edge represented by the major resistance level at 1.42200, and a lower edge represented by the major support level at 1.38500.
The most substantial development took place several days ago when the price action managed to break down below the range's lower boundary, which is the main reason substantiating the expectations for the establishment of a new major bearish trend. Nevertheless, the price action has not been especially committed to continuing heading lower seeing as how the last three days it has been consolidating very narrowly. The bodies of the last three candlesticks are tiny, which underscores the uncertainty in the market, and the possibility for a reversal.

Three main reasons are justifying such expectations for a new bullish correction. First of all, the ADX has been threading below 25 points since the 13th of April, which underlines the strong range-trading bias in the market. If this sentiment were to persist then an upswing of the price action back within the boundaries of the range is going to be the most obvious outcome.
Second of all, the Stochastic RSI is already threading within the 'Oversold' extreme, and if the majority of traders believe that the range-trading environment is going to remain prevalent, then they would most likely perceive the behaviour of the RSI as a justification to execute long orders on the expectation for a new upswing. Such actions, in turn, are going to affect the underlying buying and selling pressures by directly tipping the balance in favour of the former. With rising buying pressure, the price action is going to receive the necessary bullish support to form the aforementioned upswing.
Third of all, the price action has been consolidating just above the lower boundary of the ascending channel, and it has been doing so for the last three days after the breakdown. This behaviour casts a shadow of doubt over the continuation of the bearish trend's development and favours the formation of a new bullish correction. Such a correction could easily reach the major support level at 1.38500, which has now turned into a resistance.
Hence, even if the newly developing bearish trend is temporarily stopped around the current market price, this will not signify its conclusion. Instead, a minor bullish correction could form now, before the broader markdown can continue advancing further south. The first significant target-level for such a downtrend is going to be the 61.8 per cent Fibonacci retracement level at 1.36123.
2. Short-Term Outlook:

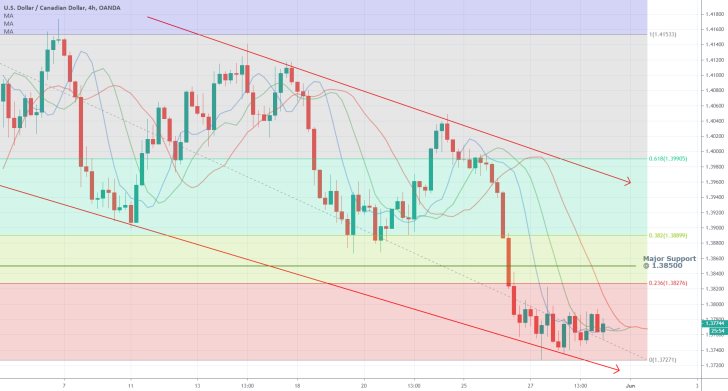
As can be seen on the 4H chart above, the three Moving Averages – the 13-day MA (red), the 8-day MA (green) and the 5-day MA (blue) – have all converged towards the same level. This confirms the diminishing bearish commitment in the short run and could support the formation of a new bullish correction.
As was mentioned earlier, such a correction could reach the major resistance level at 1.38500 before it gets terminated. However, this could happen even sooner. There is a minor 23.6 per cent Fibonacci retracement level at 1.38276, which could serve as an intermediate resistance level and a potential turning point for a bullish correction.
If somehow the price action manages to break out above the 23.6 per cent Fibonacci retracement level and the major resistance level at 1.38500, the next major obstacle for such a bullish correction is going to be the minor 38.2 per cent Fibonacci retracement level at 1.38899. At any rate, there are plenty of potential turning points, which would present the market bears with an opportunity to enter short at a discount should the price action establish a new upswing (bullish correction). They would be able to do so at one of the three probable peaks presented above.
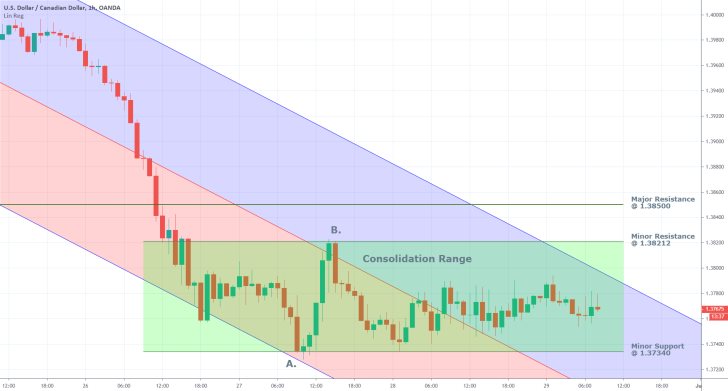
The hourly chart below reveals a minor consolidation range, which encompasses the price action during the last three days after the breakdown on the daily chart above. Point A confirmed the range's lower boundary - the minor support level at 1.37340, which coincided with the regression channel's lower edge. Meanwhile, the range's upper border was confirmed at point B, when the minor resistance level at 1.38212 coincided with the regression channel's middle line.

3. Concluding Remarks:
A breakout above the minor consolidation range's upper boundary is likely going to signify the establishment of a more substantial bullish correction. In contrast, a breakdown below the range's lower edge could indicate the probable immediate continuation of the bearish trend's establishment.

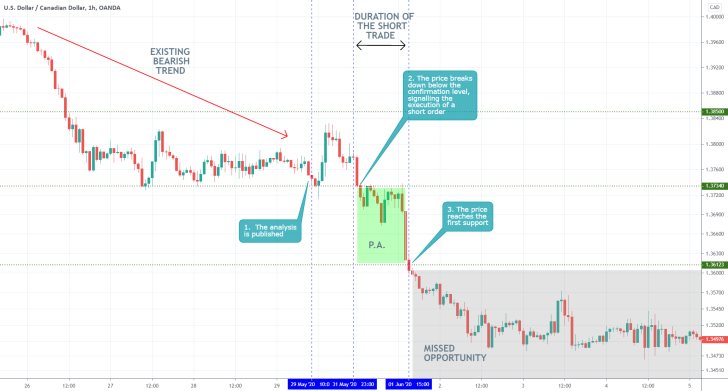
- The analysis was spot on in anticipating the downtrend to be continued. It also was quite successful in pinpointing the extent of the bullish correction, which came very close to the resistance at 1.38500. The suggested entry point below the crucial test level at 1.3740 was also excellent, given that this is where the bullish correction was evidently terminated. Despite all of this however, the analysis failed in arguably the most important aspect – it did not allow for the downtrend to be extended below the support at 1.36123. Sometimes the fear of losing one's running profits could compel traders to exit out of a position prematurely, which frequently results in missed opportunities for further gains. Traders need to have the mental stamina to watch their trades evolve over time; furthermore, they can use floating take profits in order to catch more pips whenever the price enters into uncharted territory.
Disclaimer: Your capital is at risk! Trading and investing on the financial markets carries a significant risk of loss. Each material, shown on this website, is provided for educational purposes only. A perfect, 100% accurate method of analysis does not exist. If you make a decision to trade or invest, based on the information from this website, you will be doing it at your own risk. Under no circumstances is Trendsharks responsible for any capital losses or damages you might suffer, while using the company’s products and services. For more information read our Terms & Conditions and Risk Disclaimer.


