The price of Ethereum plummeted sharply earlier today following a sweeping selloff in the crypto market. Over the last couple of days, Bitcoin, the benchmark cryptocurrency, fell by over 6 per cent.
Multiple factors are contributing to the selloff, with the most significant one being the temporary strengthening of the dollar. The greenback is currently advancing ahead of the release of the December non-farm payrolls report in the U.S., which is scheduled to take place tomorrow.
Additionally, there seems to be a lot of speculative trading going on in the crypto market at present, as the general trading activity is once again picking up steam from the Festive crunch. The majority of market participants expect, or rather hope, to see Bitcoin and the other major cryptos starting to rise once again, following the completion of a major correction. It is the consequence of such mass-market psychology that usually leads to surprising market turns.
Market whales love to trade against the popular opinion of smaller retail traders by driving the price action of a given asset towards an area that is poised to contain multiple stop-loss orders of those retail traders. This creates a temporary misbalance in the underlying buying and selling equilibrium, yielding massive profits for the whales.
Smaller retail traders can take advantage of this by trying to position themselves accordingly to the positions of such whales rather than attempting to fight the market. With regard to the current set-up on Ethereum, this would entail the newly emerging downtrend.
The next bullish pullback is likely to be perceived by the majority of small retail traders and investors as their long-awaited sign of stabilisation, likely prompting them to action. But there is a very high likelihood that the next such pullback would rather pan out to be another misleading movement prompted by market whales.
That is why the underlying setup seems suitable for the implementation of trend continuation trading strategies by bears looking to sell the peak of the pullback rather than hoping for a miraculous change of the market direction.
Charting the New Downtrend
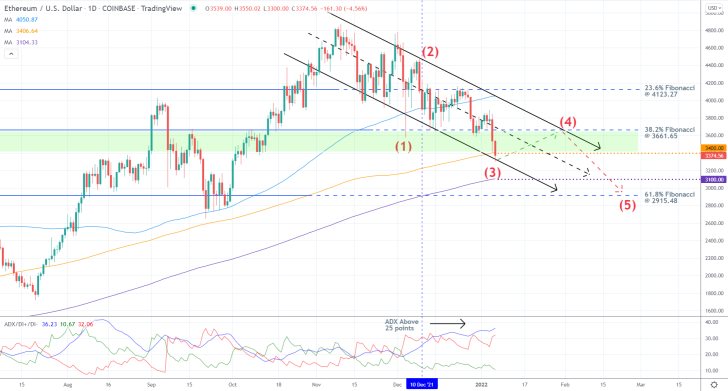
As can be seen on the daily chart above, the new downtrend has actually been unfolding for quite a while now; it is represented as a descending channel. Additionally, it takes the form of a 1-5 impulse wave pattern, as postulated by the Elliott Wave Theory.
Given that the second impulse leg (2-3) is currently testing the lower limit of the channel, which is positioned close to the major support level at 3100.00 (underpinned by the 300-day MA in purple), the second retracement leg (3-4) may be due next. It could reach as high as the 38.2 per cent Fibonacci retracement level at 3661.65 before the downtrend can be resumed.
Such a pullback can also emerge right away from the major support at 3400.00, which is underpinned by the 200-day MA (in orange). At any rate, the 61.8 per cent Fibonacci at 2915.48 seems like the next most likely target for the downtrend. Its significance stems from its close proximity to the psychologically significant threshold at 3000.00.
The fact that the ADX indicator has been rising above the 25-point mark since the 10th of December signifies the increasingly more pronounced bearish commitment in the market.
The Fractal Nature of the Price Action in the Short Term
As shown on the 4H chart below, the downtrend has thus far been developing sharp twists and turns, elucidating the fractal nature of the price action. This behaviour of the price action manifests itself in the formation of intermediate structures such as wedges and flags. Meanwhile, the MACD picked up the sudden upsurge of bearish momentum.
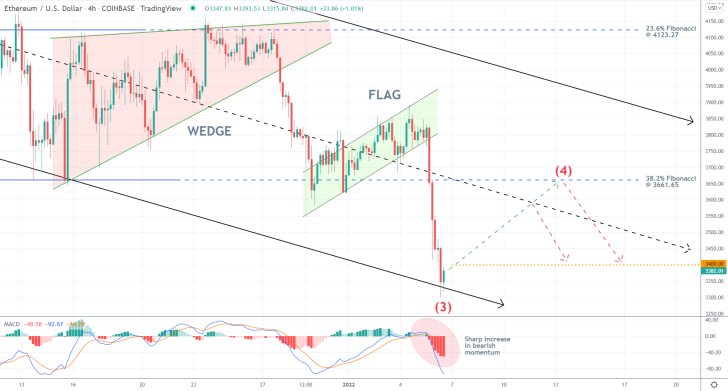
Bulls and bears alike should pay close attention to the behaviour of the price action between the lower limit of the channel and the aforementioned 3400.00 level. This small area creates a minor bottleneck of sorts, which is where a pullback is most likely to emerge from.
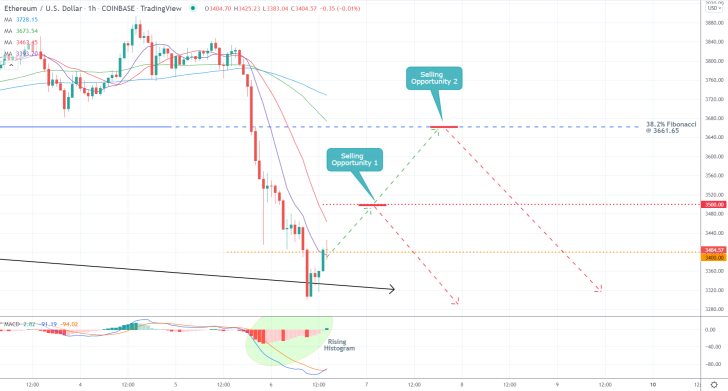
These expectations for a temporary break in the broader downtrend are further exemplified on the hourly chart below. The two EMAs of the MACD are about to cross each other, while the histogram of the indicator has been steadily rising over the last several hours.
Notice that the 10-day MA (in purple) is currently converging with the 3400.00 support-turned-resistance, making it an even more prominent turning point. Meanwhile, the 20-day MA (in red) underscores the minor resistance level at 3500.00, which is where the next pullback could peak if the price action manages to penetrate above 3400.00.
The next potential turning point is the 38.2 per cent Fibonacci, which is about to be crossed by the 50-day MA (in green) and 100-day MA (in blue).
Concluding Remarks
Bears can therefore place short limit orders either at 3500.00 or 3661.65, depending on their level of risk aversion. In either case, their supporting stop-loss orders should not be placed more than several hundred dollars above their initial entries. Once the price action draws near the 61.8 per cent Fibonacci, they could substitute their fixed stop orders for floating TPs. That way they would be able to catch a potentially deeper breakdown below this last Fibonacci threshold.
Ethereum is Attempting a Breakout. Is it Time to Go Long?
The price action of Ethereum is currently attempting a breakout from the latest downtrend. Does this mean that the time to buy the crypto is finally here? It all boils down to the manner in which the downtrend has bottomed out if indeed it has done so already.
The uptick from the last several hours is being prompted by the testimony of Jerome Powell, the Chair of the FED, which is causing a simultaneous dollar depreciation. In other words, demand for higher-risk assets is once again rising in the very short term at the expense of the greenback. But is this change going to last over the next several days?
It all boils down to what this week's inflation numbers in the U.S. reveal about the current pace of the country's recovery. Meanwhile, bulls could still try to take advantage of the current setup, which would allow them possible early entry into a new uptrend. However, they should keep in mind that implementing contrarian trading strategies is usually a lot riskier compared to riding an existing trend. Ethereum bulls should therefore be especially precise in their trade execution.
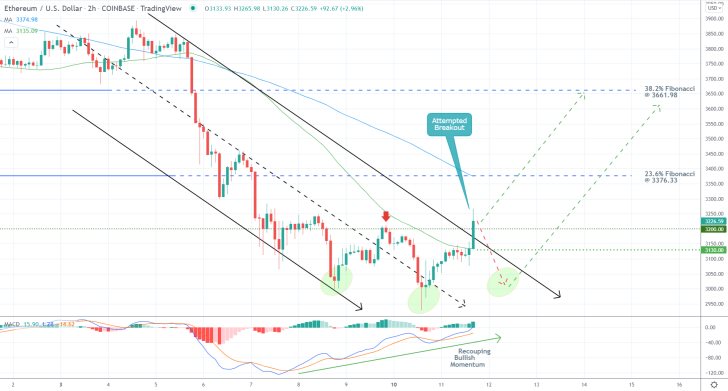
As can be seen on the 2H chart above, the attempted breakout is currently unfolding just above the upper limit of the descending channel. This is the first major bullish indication. Nevertheless, there are no guarantees against the possibility of sudden reversals, which would render the pullback a false movement.
The emergence of a new uptrend could therefore entail another interim dropdown towards the latest dip, which could potentially signify the development of a Head and Shoulders pattern with a neckline at 3200.00.
The price action is currently attempting to penetrate not only above the upper limit of the channel but also the neckline of the potential head and shoulders. This is what makes the attempt so crucial. It is unfolding while the underlying bullish momentum is steadily rising, as underpinned by the MACD indicator.
Depending on their level of risk aversion, bulls can take advantage of this setup in one of two ways. They could go long around the current spot price or place long limit orders around the latest swing low. If they choose the former option, then their supporting stop-loss orders should be placed no deeper than the major support at 3130.00. The latter is underscored by the 50-day MA (in green).
The first target for the new uptrend would be the 23.6 per cent Fibonacci retracement level at 3376.33, which is currently converging with the 100-day MA (in blue). If the underlying bullish commitment is strong enough to drive the price action past these two obstacles, then the uptrend could head towards the 38.2 per cent Fibonacci at 3661.988.
To be safe, bulls could substitute their fixed stop orders for floating TPs once the price action draws near this first Fibonacci threshold.
Potential Rebound on the Price of Ethereum from the Psychological Support
The cryptocurrency's price action currently finds itself in a very strong downtrend. However, it is drawing near the psychologically significant support level at 3000.00, where a bullish rebound would seem highly probable. This is further substantiated by the fact that the price action has already rebounded from this threshold recently.
The crypto market continues to be roiled by the soaring inflation globally, which marks a transformational change in the market. Investors no longer seem to be interested in these high-risk assets during a general market turmoil. This means that Ethereum and Bitcoin's correlation with the dollar is now becoming increasingly more pronounced.
At the same time, crypto investors are still looking for an opportune moment to go long, which would likely create a sudden upsurge of buying pressure. This, in turn, can be taken advantage of by bulls looking to implement contrarian trading strategies. This is why the psychological support at 3000.00 seems like the most suitable place for this.
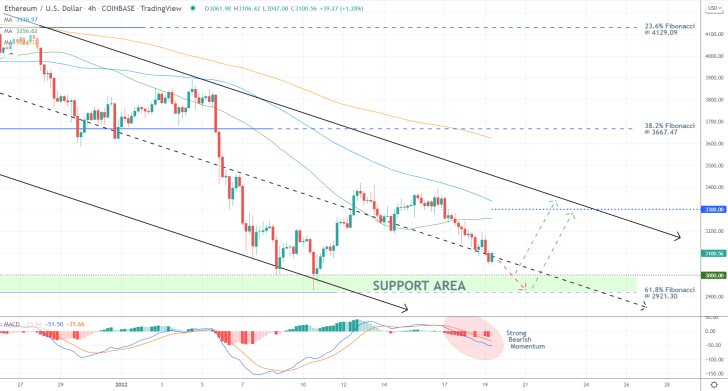
As can be seen on the 4H chart above, the price action is currently consolidating around the middle line of the descending channel. Penetration below it would clear the way for the underlying downtrend to head towards the major Support Area (in green).
The latter represents a very probable turning point for two reasons. Firstly, its upper limit is underscored by the aforementioned psychological support at 3000.00. Its lower boundary, in turn, is represented by the 61.8 per cent Fibonacci retracement level at 2921.30. The latter is the last Fibonacci threshold as measured against the broader (last) uptrend.
All of this makes a rebound in the near term seem highly probable. However, bulls should not disregard the fact that the underlying momentum remains ostensibly bearish-oriented, as underlined by the MACD indicator. At the same time, its histogram is slowly increasing, which represents a very early indication of a possible rebound in the near future.
Depending on their level of risk aversion, bulls can trade this set-up in one of two ways. They can either place long limit orders at the psychological support at 3000.00 or the 23.6 per cent Fibonacci at 2921.30. Either way, their supporting stop-loss orders should not be deeper than $40 below their initial entries.
Their first target would be the major resistance level at 3300.00, which would soon converge with the upper limit of the descending channel. Its prominence would be underpinned by the 50-day MA (in green) and 100-day MA (in blue).
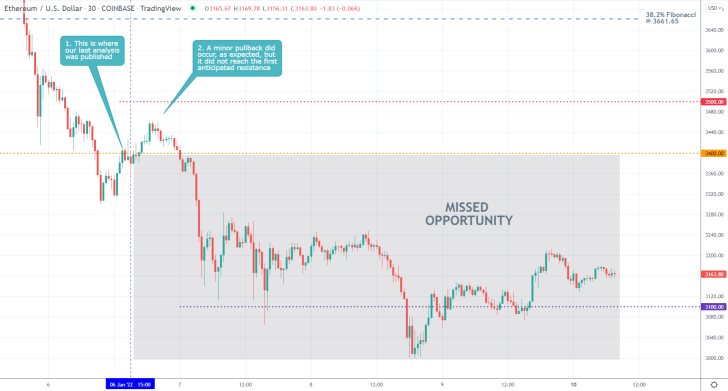
- The expectations of our last Ethereum analysis did pan out, but unfortunately, the setup was not utilised. That is so because the pullback that followed the publication of the analysis did not reach the first selling level at 3500.00.
- The subsequent dropdown reached the first target level at 3100.00.
- Though frustrating, such missed opportunities should not be considered failures. It is better to stay true to one's strategy rules even if it means that from time to time, one would be missing such opportunities.
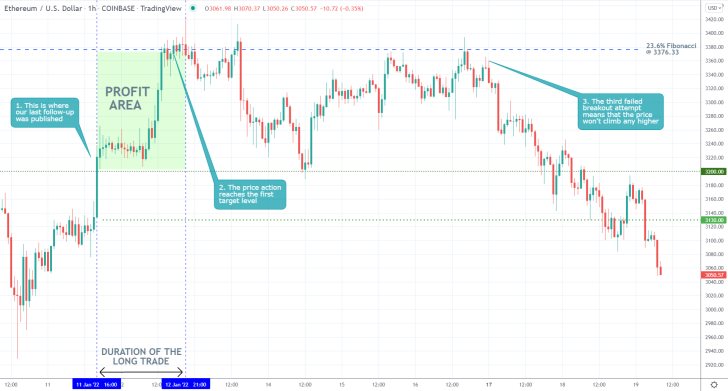
- Our last Ethereum follow-up successfully forecasted the continuation of the breakout above the 3200.00 resistance towards the 23.6 per cent Fibonacci retracement level at 3376.33.
- However, after three failed attempts, the price action could not break higher.
- Altogether, the long trade garnered more than 4.50 per cent in profits.
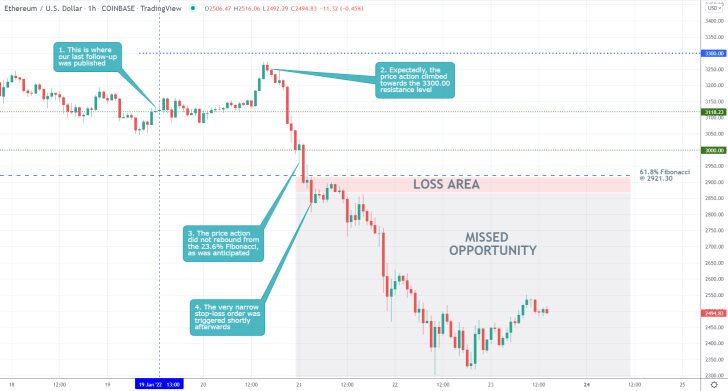
- The pullback on Ethereum that was forecasted by our last follow-up on the crypto occurred sooner than expected, which is why it could not be taken advantage of.
- Meanwhile, the price action did not rebound from the 61.8 per cent Fibonacci retracement level at 2921.30, which resulted in a small loss on the contrarian trade.
- That is why it is so vital to implement very narrow stop-losses when implementing contrarian trading strategies.
Disclaimer: Your capital is at risk! Trading and investing on the financial markets carries a significant risk of loss. Each material, shown on this website, is provided for educational purposes only. A perfect, 100% accurate method of analysis does not exist. If you make a decision to trade or invest, based on the information from this website, you will be doing it at your own risk. Under no circumstances is Trendsharks responsible for any capital losses or damages you might suffer, while using the company’s products and services. For more information read our Terms & Conditions and Risk Disclaimer.


