Platinum is one of the most-traded assets in the commodities market, which makes it one of the primary gauges for the overall stability of the broader market. Its price action in the wake of the coronavirus crash could be quite telling of the underlying processes currently taking place in the commodities market, which is why it deserves close attention.
Platinum has managed to recover most of the initial losses that were incurred in the early days of the market turmoil, but its price action has become relatively stagnant over the last several days. Such muted price action, which has already been observed in the stock market and the FX market, could be an early indication of diminishing bullish commitment in the market. It could thereby signify the termination of the underlying bullish correction.
That is why the purpose of today's analysis is to examine the behaviour of Platinum's price action around several crucial resistance levels and to determine whether or not the recent bullish correction is indeed drawing to an end. If so, what's installed next for the prominent commodity?
1. Long-Term Outlook:
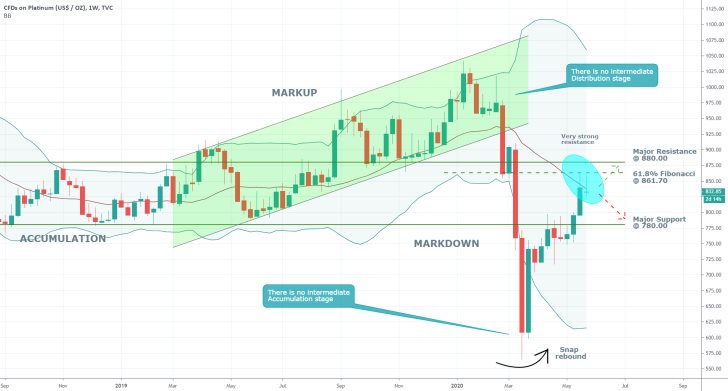
As can be seen on the weekly chart below, the coronavirus crisis caused a sudden end to the last Markup's development, which was then followed by a substantial Markdown. The latter was subsequently terminated just as abruptly and followed by the aforementioned bullish correction. The apparent lack of a Distribution range separating the Markup and the Markdown, and an Accumulation range to separate the Markdown and the current bullish correction underscores the uncertainty of the coronavirus crash.
The market would eventually have to find a new equilibrium resembling the Wyckoff cycle, but for this to take place, the erratic price action needs to stop. Such a process of harmonization tends to occur during a protracted period of range-trading sentiment, throughout which the underlying buying and selling pressures finally manage to find a new balance. Hence, it can be inferred that the market is most likely going to transition from a trending environment, represented by the bullish correction, into a distinctive range-trading environment. Indeed, there is already plenty of evidence justifying such assertions.

Firstly, the tightening Bollinger Bands manifest an early indication of diminishing adverse volatility, which favours the transition of the market into set range-trading environment. Additionally, the price action has been contained below the BB's middle line over the last couple of weeks (though this could still change by this Friday), which is demonstrative of strong resistance around the current price.
The tops of the last two candles have reached and subsequently rebounded from the 61.8 per cent Fibonacci retracement level at 861.70, and this is yet another confirmation of this strong resistance that was mentioned earlier.
In addition to the Fibonacci retracement level and the BB's middle line, there is also the major resistance level at 880.00 nearby. The close proximity of the three to each other make a potential continuation of the current bullish correction, which is already demonstrating early signs of exhaustion, seem unlikely.
The underlying price action could be contained within a broad range, which would meet the aforementioned expectations for observing an undecided market sentiment while the buying and selling pressures find a new equilibrium. The major resistance level at 880.00 could serve as an upper boundary for such a range, given that it already had a similar role the last time that the market was range-trading. This was during the formation of the previous Accumulation range, which had the 880.00 resistance as its upper boundary. Accordingly, the major support level at 780.00, which served as the Accumulation's lower boundary, could undertake the same role yet again.
Notice also that the body of such a range is going to be equal to 100 points, which is psychologically significant, thereby making it more probable. This is especially true given that there has already been a range with such a body – the last Accumulation.
2. Short-Term Outlook:

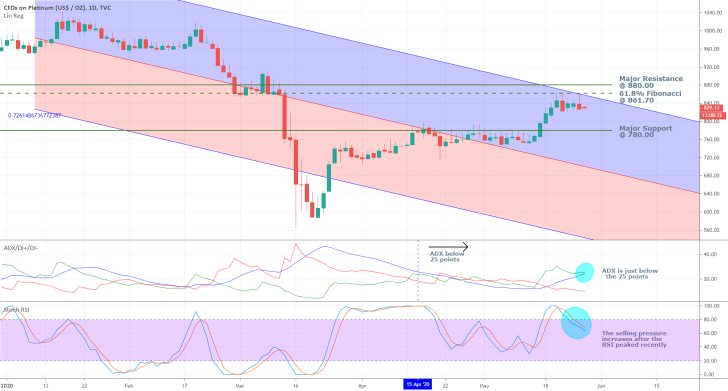
As can be seen on the daily chart above, the congruency of underlying evidence signalling the formation of a new range continues to increase. The price action is trading very close to the regression channel's upper boundary, which typically serves as a prominent turning point for the underlying direction of the price action. This is not to say that a breakout above it is entirely impossible. However, at present, the accumulation of so much consistent evidence from different sources against the notion seems overwhelming.
Moreover, the ADX has been threading below 25 points since the 15th of April, which confirms the market is structurally already range-trading. This favours the likely rebound of the price action from the current resistance.
Finally, the Stochastic RSI has recently reached the 'Overbought' extreme and is currently falling, which underpins rising selling pressure. This behaviour is to be expected when the price action is contained within the boundaries of a range, and it also favours the implementation of swing trading strategies whenever the price action nears one of the two edges of set range.
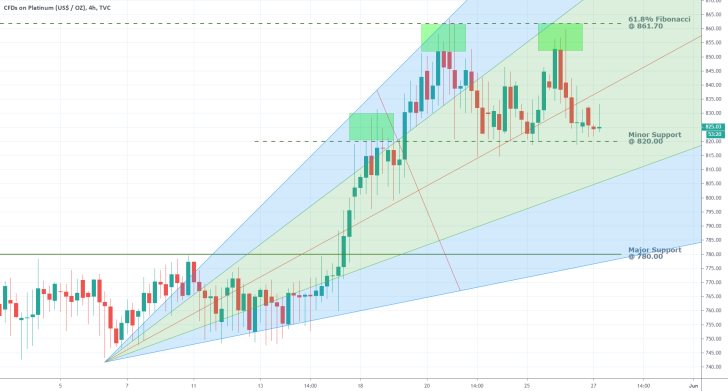
An examination of the price action in the short term reveals that it is close to finishing establishing a Double Top pattern, which typically is followed by a downswing/trend. This fulfils the expectations from earlier for a new rebound below the major resistance level at 880.00, or the 61.8 per cent Fibonacci retracement level at 861.70.

3 Concluding Remarks:
If the price action manages to break down below the minor support level at 820.00, this would be yet another evidence in confluence with the rest of the presented observations. Unsurprisingly, the most significant target of a new downswing is going to be the aforementioned major support level at 780.00, which currently coincides with the pitchfan's lowest boundary. This further increases the level's prominence as a potential turning point for the underlying direction of Platinum's price action.

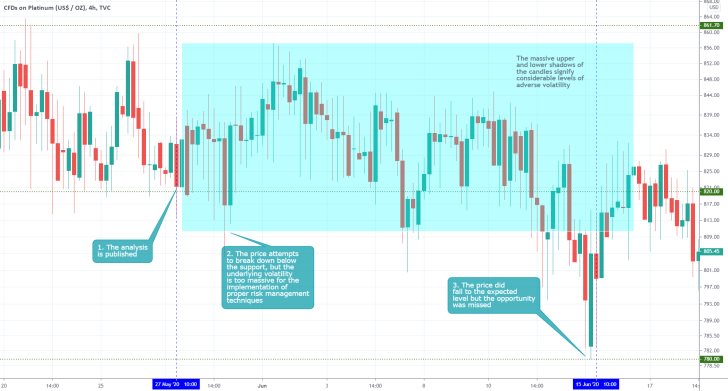
- The above setup manifests one of those rare occasions in which the projected downswing was realised, and yet, the opportunity was not utilised. Any simple market order that is placed in such highly volatile markets, as observed by the massive shadows and tails of the candles, is bound to be wiped out by one of those erratic fluctuations. The analysis was correct in anticipating the price to drop to the support at 780,00, but it could have done a better job of explaining how the underlying setup could have been exploited with the proper techniques.
- Whenever the market is exhibiting such seemingly erratic behaviours on charts with smaller timeframes, one is advised to use options instead of CFDs. A properly structured option would catch the bigger price swing while ensuring protection against such volatility outbursts in the short-term.
Disclaimer: Your capital is at risk! Trading and investing on the financial markets carries a significant risk of loss. Each material, shown on this website, is provided for educational purposes only. A perfect, 100% accurate method of analysis does not exist. If you make a decision to trade or invest, based on the information from this website, you will be doing it at your own risk. Under no circumstances is Trendsharks responsible for any capital losses or damages you might suffer, while using the company’s products and services. For more information read our Terms & Conditions and Risk Disclaimer.


