Despite the successful vaccination process in the U.S., the underlying recovery is still uneven. The impact of the pandemic continues to be sporadic and bumpy across different sectors of the economy. The impact of this spillover is likely to be underpinned by the Services PMI data, scheduled for publication later today.
The need to hedge against the widening discrepancy in the pace of global recovery is thus likely to prompt investors to turn to gold as the gap separating developed economies and emerging markets continues to grow.
Additionally, bullish pressure is likely to be bolstered on Friday by the latest U.S. non-farm payrolls data. Even though the consensus forecasts project more than 1 million jobs to have been created over the previous month, traders should pay especially close attention to the long term unemployment numbers.
Many people in the U.S. opt to remain out of the labour force due to the coronavirus pandemic and to live off their stimulus checks. This trend poses a sizable threat to the broader recovery, which could result in an even higher demand for safe havens as a consequence.
Given all of this, the commodity is more than likely to continue heading north in what is starting to look like a major rally in the works.
1. Long-Term Outlook:
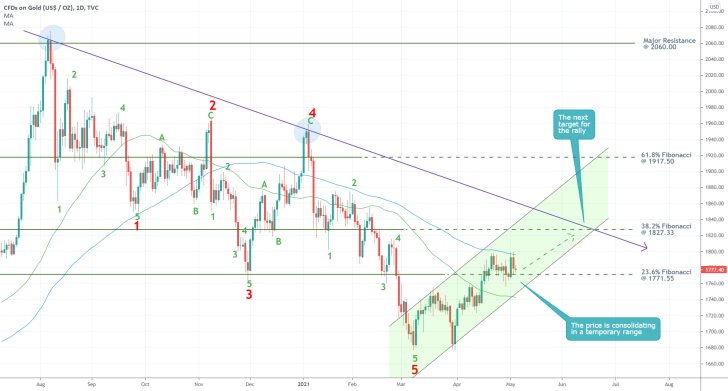
The price of gold looks poised to continue developing a new uptrend following the completion of the preceding downtrend. The price bottomed out at 1680.00, which is where a major 1-5 impulse wave pattern, as postulated by the Elliott Wave Theory, was completed. Then, the price action developed an inverted double bottom pattern, which is typically taken to signify mounting bullish pressure.
At present, the price of gold is advancing within the boundaries of an ascending channel. The first significant milestone in the development of the new uptrend was encapsulated by the breakout above the 23.6 per cent Fibonacci retracement level at 1771.55. The price is currently consolidating above this resistance-turned-support and below the 100-day MA (in blue).
Once this temporary range is concluded, the price would be ready to resume climbing. The next logical target is encapsulated by the 38.2 per cent Fibonacci at 1827.33.
The latter is about to be crossed from above by the descending trend line (in purple), which has already caused two major reversals. That is why the price of gold is likely to struggle before it manages to penetrate above 1827.33 decisively.
On the other hand, the 50-day MA (in green) currently serves as a floating support, accompanying the emerging uptrend. If, however, the price does manage to break down below the 50-day MA, this would signify the potential termination of the bullish setup.
2. Short-Term Outlook:
As can be seen on the 4H price chart below, the price action has indeed been consolidating in a narrow range as of late. Before the price of gold could continue climbing higher, it could fall to the bottom of the ascending channel one more time. Such a type of adverse fluctuation would be completely inlined with the erratic nature of consolidation ranges like the one presently observed.
There are plenty of reasons to expect a rebound from the lower end of the ascending channel. While the price action is currently being concentrated above the 100-day MA (in blue) and the 50-day MA (in green), the 150-day MA (in orange) and the 200-day MA (in purple) are rising parallel to the lower edge of the channel.
Moreover, the latter is also being crossed by the resistance-turned-support level at 1755.00, which represents yet another major turning point. Given that the 23.6 per cent Fibonacci is also thrown into the mix, all of these factors seem to suggest that there is considerable buying bias between the current price level and 1755.00.
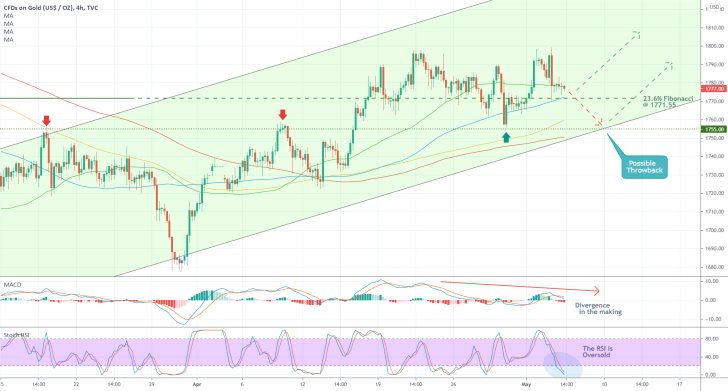
The likelihood of a potential drop down to the lower boundary of the channel is supported by the fact that the MACD indicator registered a bearish crossover recently. When the evolving divergence is examined in light of the growing selling pressure in the short term, as depicted by the oversold Stochastic RSI indicator, the possibility of such a bearish correction becomes even more apparent.
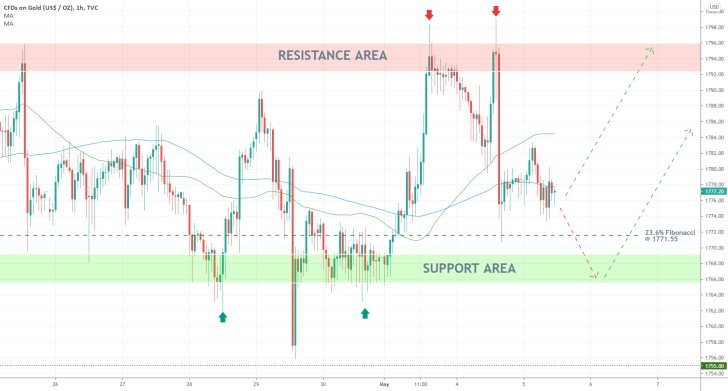
The temporary range that was mentioned above is depicted on the hourly chart below. The price action continues to bounce between the resistance area (in red) and the support area (in green), which can be used by bulls as an opportunity to determine when to go long.
The recent rebound from the 50-day MA confirms the expectations for another dropdown towards the support area, which is where bulls can look for an opportunity to join the market.
3. Concluding Remarks:
While bulls can even try to go long near the current price, they should keep in mind that adverse fluctuations could drive the price of gold as low as the 1755.00 support level, which would trigger and narrow stop-loss orders. That is why bulls should remain cautious and patient.
Time for a Correction on the Price of Gold
The price of gold is in the early stages of developing a new major uptrend; however, this does not preclude the possibility for the emergence of interim corrections. As it is about to be seen, the current confluence of bearish indications seems to suggest that the time is right for the development of one such dropdown.
Following the massively volatile previous week, the economic calendar for the next several days seems rather uneventful in comparison. The commodity's price advanced considerably last week, given this robust commitment in the market, as global demand continued to lift.
But except for the crucial inflation data in the U.S. this week, the much more subdued market bias is likely to stymie the uptrend. Hence, the underlying fundamentals seem favourable for the emergence of a new bearish correction.
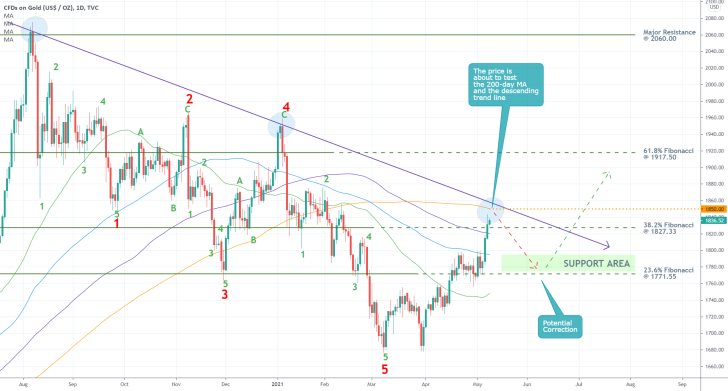
As can be seen on the daily chart above, the price action is currently nearing the descending trend line (in purple), which has already prompted major retracements on two separate occasions. Moreover, the latter currently coincides with the 200-day MA (in orange), which is also a critical floating resistance.
That is why a potential retracement from the 1850.00 level seems highly probable. Moreover, the breakout above the 38.2 per cent Fibonacci retracement level at 1827.33 only happened today, which means that the breakout is still quite tentative. This makes a potential bearish rebound seem even more likely.
On the condition that the price action does indeed break down below the 38.2 per cent Fibonacci retracement level, the next target for the developing bearish correction would be elucidated by the 23.6 per cent Fibonacci at 1771.55. That is where the correction is likely to bottom out, or, at any rate, at one of the several moving averages.
The broader outlook remains more bullish than bearish, which is why bears should not count on bigger dropdowns than that. Once the correction is exhausted, the price of gold is likely to continue advancing further north.
An eventual breakout above the 38.2 per cent Fibonacci and the descending trend line would allow bulls to drive the price of the commodity towards the next psychologically significant target level - the 61.8 per cent Fibonacci at 1917.50.
Gold Ready for an Elliott Retracement Leg
The price of gold remained relatively flat over the last couple of days amidst growing uncertainty in the crypto market. The tribulations resulting from China's decision to ban cryptocurrency transactions exacerbated investors' concerns and caused a temporary uptick in demand for safer securities.
In light of these developments, gold remains in a robust uptrend, but a correction might be due next. Stabilising economic conditions and easing tensions in the Middle East are likely to contribute to a momentary dropdown in the price of the commodity.
The Israel-Palestinian ceasefire from today is de-escalating tensions in the region, which is allowing global uncertainty levels to decrease. This is likely to lead to diminished demand for safe-havens, at least in the short-term, potentially contributing to a minor correction in the price of gold.
Nevertheless, it should be remembered that metals are entering into a new supercycle, which ensures the longer-term market bias remains ostensibly bullish-oriented.
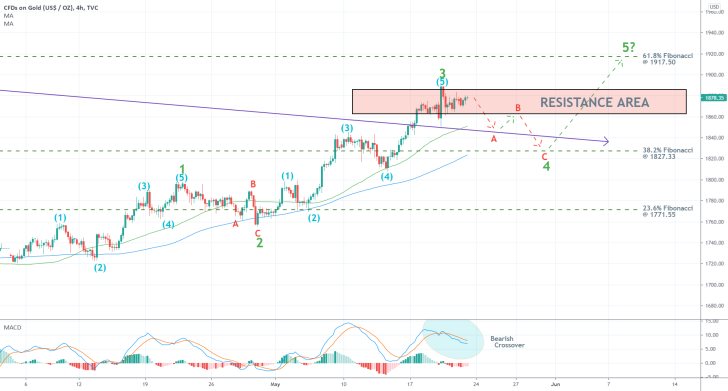
That is why the probability of a minor correction emerging next is very high, while the underlying outlook remains prevailingly bullish. This can also be inferred from the 4H chart above.
The latest uptrend on the price of gold can be represented as a major 1-5 impulse wave pattern (in green), as postulated by the Elliott Wave Theory. Each leg of this pattern can, in turn, be examined as a smaller 1-5 pattern itself.
The most significant development of the second impulse leg (2-3) of the broader pattern is that it managed to break out above the descending trend line (in purple), which was examined in greater detail in the initial analysis.
Having reached a peak at point 3, near the major Resistance Area (in red), the broader pattern now seems ready to establish the second retracement leg (3-4). This leg is likely to take the form of a corrective ABC pattern, similarly to the first retracement leg (1-2).
An ABC correction could fall to the 38.2 per cent Fibonacci retracement level at 1827.33 before the bullish market commitment is reinvigorated. The descending trend line is also a likely contender to act as a dip of this upcoming correction.
At present, the 50-day MA (in green) is nearing the descending trend line, whereas the 100-day MA (in blue) is about to converge with the 38.2 per cent Fibonacci. Both of these moving averages serve as potential turning points.
The bearish crossover on the MACD indicator confirms the expectations for the emergence of a bearish correction in the short term. Bears, thus, can utilise contrarian trading strategies at present.
Bulls, in contrast, can also take advantage of this setup by waiting to buy the dip. They can look for an opportunity to go long near the 38.2 per cent Fibonacci, on the expectations for the subsequent emergence of the final impulse leg (4-5). It is likely to appreciate towards the 61.8 per cent Fibonacci at 1917.50.
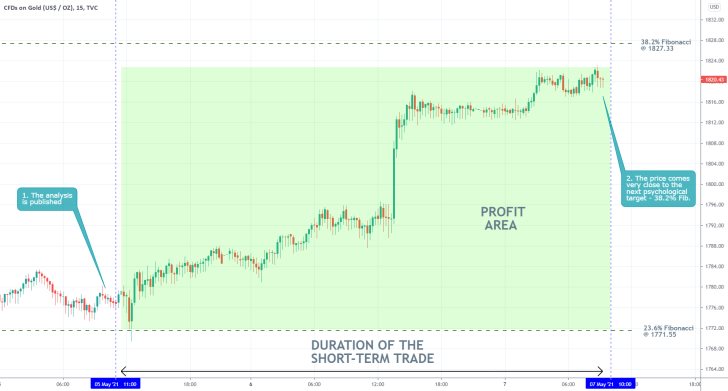
- The expectations of the analysis started getting realised almost immediately after its publication. The price action started appreciating right away and is currently nearing the next psychologically significant target level - the 38.2 per cent Fibonacci retracement level at 1827.33.
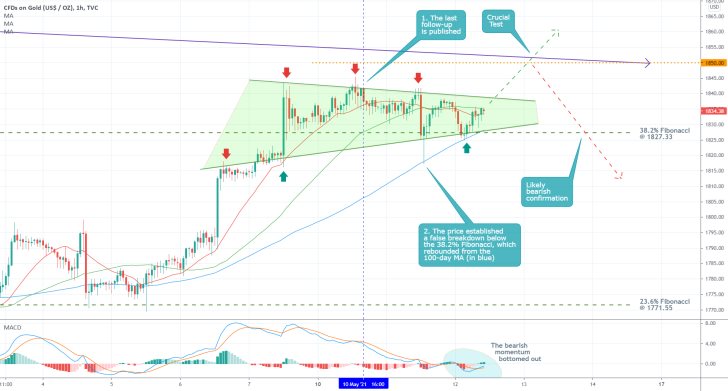
- The price of gold continues to consolidate in an increasingly narrower bottleneck between the 38.2 per cent Fibonacci and the descending trend line (in purple), after the publication of the last follow-up. This is expected, and the market is yet to commence a decisive directional trading in either direction.
- Both bulls and bears should observe carefully the behaviour of the price action around this trend line, as a potential breakout above it would mean that bullish sentiment is likely here to stay.
- Conversely, a potential reversal from it would give bears a chance to open short orders, eyeing further dropdowns.
- The expectations for a bullish test of the 1850.00 resistance level in the near future are substantiated by the fact that the underlying bearish momentum has nearly bottomed out (demonstrated by the MACD), and the price is unable to penetrate below 1827.33 at present.
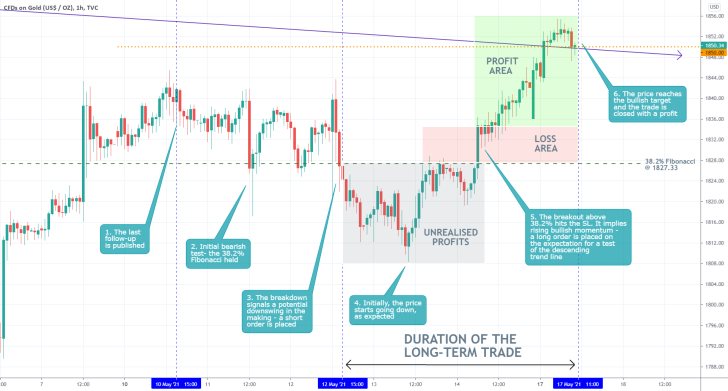
- Shortly after the publication of the last follow-up analysis, the price of Gold broke down below the 38.2 per cent Fibonacci retracement level, which signalled the execution of a short trade. However, the subsequent breakout above 1827.33 terminated the selling position.
- Despite the incurred losses, the follow-up accurately projected the eventual appreciation of the price to the descending trend line.
- This is the major threshold that bears have been waiting for. A potential reversal from the trend line (in purple) and the semi-psychological resistance at 1850.00 would represent a much more important bearish indication. Potentially signalling the beginning of a much bigger bearish correction.
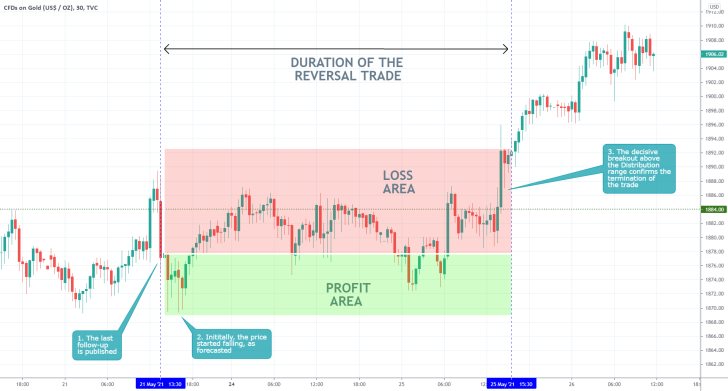
- The price of gold went on to consolidate near the upper boundary of the Distribution range that was outlined in the last follow-up analysis of the commodity. Despite the expected reversal, however, it eventually broke out above the resistance and resumed climbing.
- This hit the SL of the trade and terminated it.
Disclaimer: Your capital is at risk! Trading and investing on the financial markets carries a significant risk of loss. Each material, shown on this website, is provided for educational purposes only. A perfect, 100% accurate method of analysis does not exist. If you make a decision to trade or invest, based on the information from this website, you will be doing it at your own risk. Under no circumstances is Trendsharks responsible for any capital losses or damages you might suffer, while using the company’s products and services. For more information read our Terms & Conditions and Risk Disclaimer.


