The safe-haven asset continues to soar without being interrupted as its price surpassed the 1600 level for the first time since March 2013. Gold's strong bullish trend was initiated in October 2018, and since then it has risen with more than $400 per troy ounce. The surge in gold’s price was initiated at the outset of the trade war between China and the US when investors began to fear that President Trump's protectionist policies could impede drastically international trade. Because of that, the demand for the safe-haven commodity began to rise parallel to the escalation of the spats between the world’s two biggest economies.
In late 2019 it seemed that all of these tensions were on the brink of being resolved as talks between China and the US of signing the so-called Phase One trade deal were circulating the media. The agreement was supposed to be the first significant step in the negotiations that were supposed to lessen the overall trade uncertainty. Just as the situation seemed to be stabilising, the outbreak of the novel COVID-19 overtook the spotlight from the aforementioned trade uncertainty. As fears that the deadly coronavirus can impede the global supply networks continue to rise, the demand for commodities such as gold becomes increasingly pronounced.
The health crisis in mainland China and elsewhere still seems to be far from being resolved, which means that the substantial surge in gold’s price is more than likely to persist in the foreseeable future. It would be extremely dangerous to go against the trend in such market environments, which means that most traders would be looking for advantageous positions to enter long on the currently trending market. Therefore, the purpose of this analysis is to underscore the most favourable time to enter long on the market and profit from the anticipated continuation of the current bullish trend.
1. Long-Term Outlook:
Gold broke out above the crucial 1600 level on Tuesday, which is of massive psychological importance for the future development of the price action. Such round numbers typically are perceived by the market as likely turning points in the direction of the underlying price action, as traders prefer to close out their running positions around them and collect their accumulated profits. Such actions, in turn, create discrepancies in the underlying demand pressures, which is why the direction of the price action can be anticipated to change around such psychological levels. This is important because gold is very likely to continue rising above 1600; however, some bulls could still decide to collect their profits around the current market price, which would result in the creation of a short-term boost in selling pressure.
The overall bullish trend would not be terminated because of it; however, the price is likely to temporarily consolidate and even establish a minor pullback, which would create advantageous opportunities for entering long at the dip. Thus, market psychology can be used to assess the current behaviour of the price action and potentially to execute a well-constructed trend continuation trade.

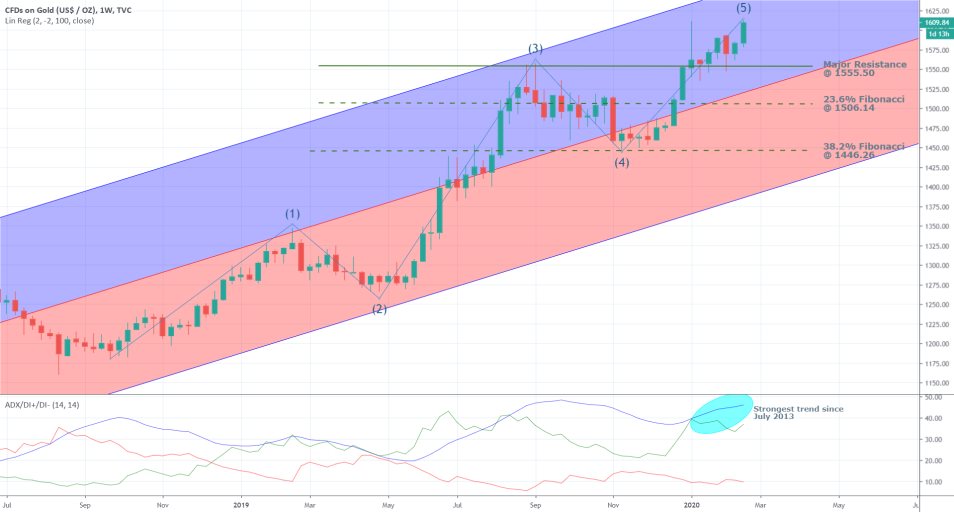
The weekly chart above demonstrates the behaviour of the substantial bullish trend. Firstly, the Average Directional Index (ADX) should be examined to determine the strength of the markup. The index is currently threading at more than 40 points, which is illustrative of a potent bullish trend and is one more reason why going short the price of gold under the current market conditions will be ill-advised. Moreover, the ADX confirms that the current trend is the strongest one on record since July 2013.
As per usual, Elliott Wave Theory can be applied in order to break down the behaviour of the price action and to underpin the distinctive impulses and pullbacks. Using the standard 1-5 impulse wave pattern, it can be discerned that the price action is currently in the process of developing the final 4-5 impulse, which confirms the expectation for the continuation of the current upswing. What is interesting to note is that the 3-4 pullback was terminated around the major support level of 1446.26, which is also the 38.2 per cent Fibonacci Retracement. In addition to that, the pullback was also held back by the ascending channel’s middle line, even though the price consolidated just below it for several weeks before it eventually continued its surge. All of these observations of the behaviour of the price action confirm the long-term bullish sentiment.
2. Measuring the Impact of the Coronavirus:
As regards the fundamentals that are currently impacting the price of gold, it should be stressed that the price of the commodity is not rising parallel to the spread of the virus. Rather, the price is rising on investors’ concerns stemming from the uncertainty that looms over the impact of the virus on the Chinese economy. So far, no solid and quantifiable ways of measuring the effect of COVID-19 on the economic growth have been advanced, which is what prompts investors to hedge against this uncertainty by seeking to move their capital to safe-haven assets such as gold.
This distinction is important because even though some indications are suggesting that the peak of the outbreak in Hubei, the largest city in the Wuhan province where the coronavirus originally came from, has already passed, new deaths are reported outside of China. This means that the impact of the virus is still going to be felt, even if the peak of the epidemic is already over. Consequently, the imprint of the virus on the Chinese economy, and by that extend on the global supply networks, is likely to persist even after a cure is eventually discovered.
A major point of contention over the past several days has been the discussion whether the uncertainty that is resulting from the spread of the coronavirus is going to turn into the unavoidable barrier that trips the already fragile global economy into a new recession, akin to the credit crunch of 2008. The short answer is that it is possible, yet, at the current moment nothing can be stated with certainty. However, what can be asserted with a positive dose of confidence is that global central banks are likely to keep their interest rates low even after the epidemic is dealt with. They would do so in order to keep favourable liquidity circulating in the global economy, sot that the overall business activity can pick up once the uncertainty is dissolved. Accommodative monetary policies are necessary not only to support growth but also to serve as insurance against such external pressures.
As regards the likely mid-term future of the gold, the expectations for the preservation of the low interest rates worldwide are likely to keep the demand for the precious commodity high well into the second part of 2020. Thereby, the current bullish trend, that is so clearly evident on the weekly chart, is likely to continue evolving at least until the beginning of the third fiscal quarter of 2020.
3. Short-Term Outlook:
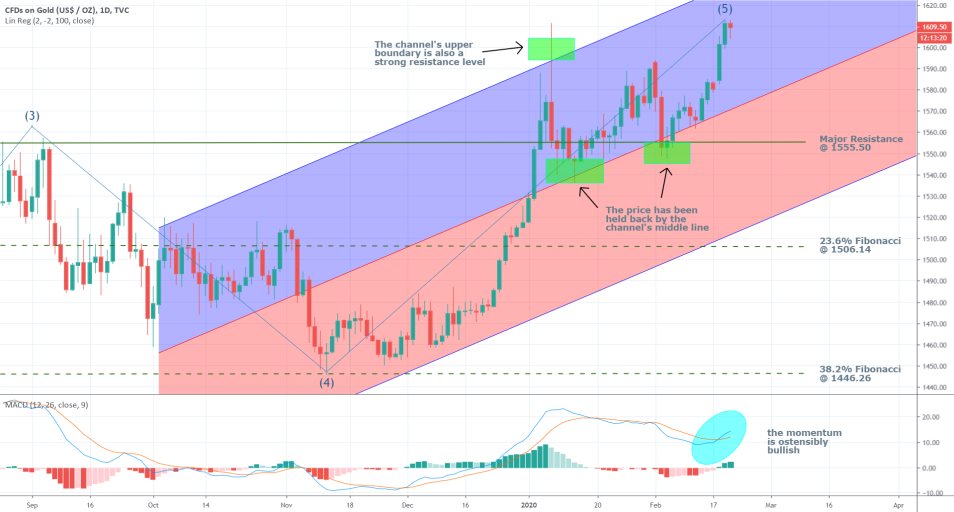
The MACD on the daily price chart below demonstrates the renewed strength of the bullish momentum in the short-term. Additionally, the price has bounced off from the linear regression channel’s middle line on two separate occasions. It has also bounced back from the channel’s upper boundary, which confirms the significance of the channel itself. Thus, judging by the behaviour of the price action on the daily chart it can be asserted that the price is likely to continue appreciating in the ascending channel, by being contained within the upper boundary of the channel and its middle line.

Moreover, it can be said that despite the ostensibly bullish momentum on the market, the price action is due for a short-term correction. This would result in the formation of an advantageous dip at which bulls can enter long into the market at a discount.
In order to discern where that dip might form, an examination of the 4H chart is needed to evaluate the short-term behaviour of the price action over the last several days.

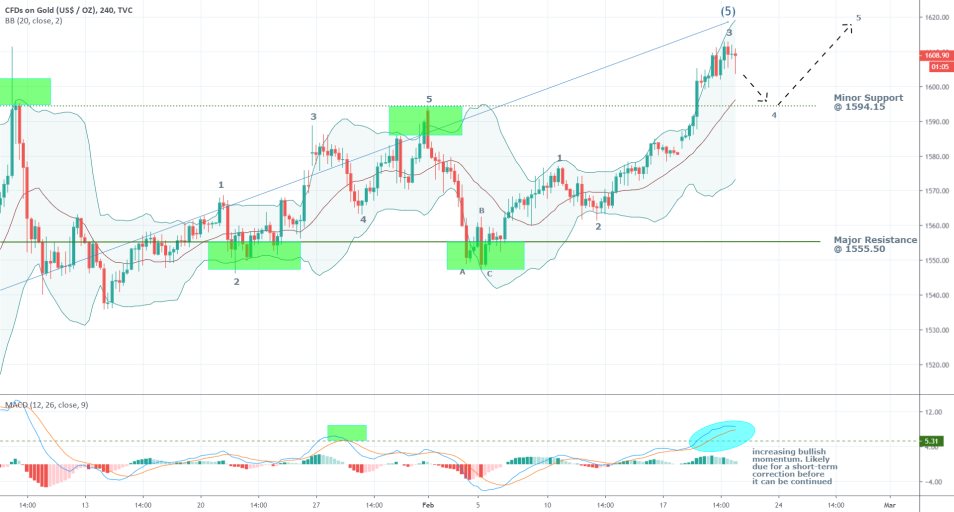
Employing Elliott Wave Theory once again, which postulates the aforementioned 1-5 impulse wave pattern, it can be seen that the price is due to establish a minor 3-4 pullback, which is a part of the major 4-5 impulse that was illustrated on the weekly chart above. Thus, this minor pullback (if it is indeed established) is what is expected to create the aforementioned dip – an advantageous level for entering long at a discount.
The minor support at 1594.15 is the most likely level at which the 3-4 minor pullback is likely to be terminated before the price resumes rising. This level is positioned just below the psychologically important 1600, which is yet another reason why the price is likely to continue surging as it offers an excellent opportunity for the execution of multiple long orders by many different traders. In other words, the minor support at 1594.15 provides an excellent level at which the overall demand in the market is expected to pick up once again.
4. Concluding Remarks:
All underlying evidence points to the likely continuation of the current bullish trend; however, traders need to join the existing trend at an advantageous level. That is why it is so crucial to wait for the creation of dips and pullbacks so that that trend continuation trading strategies can be applied for advantageous entry.
As regards the minor support level at 1594.15, it should be mentioned that its significance is further confirmed by the middle line of the Bollinger Bands, which coincides with the level itself. However, there are potential risks from opening long orders at the set level. The price can go lower before the downswing is terminated, and the development of the broader bullish trend is resumed.
The next major support level and a potential turning point is the 1555.50 price level.

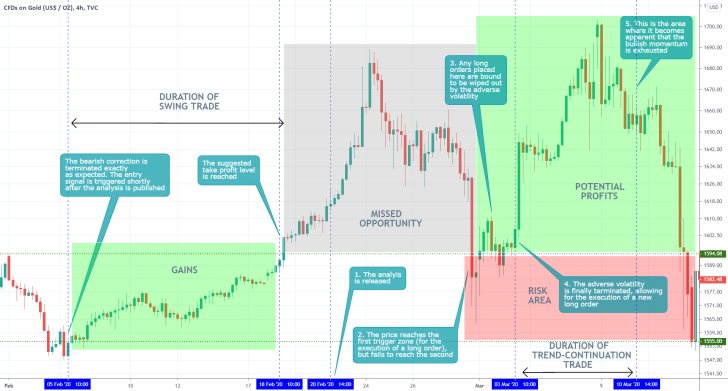
- Essentially, this analysis serves as a follow-up to the preceding analysis of gold, from the 5th of February. It further highlights the mistake of premature termination of a successful trade (regarding the swing trade that was suggested in the last analysis). The key takeaway here being encapsulated by the old trading adage that 'you should cut your losers, and allow your winners to grow'.
- The analysis suggested entering the existing bullish trend after the market established a bearish correction, but as can be seen by the grey area, the market moved quite a lot before such an opportunity was presented. Nevertheless, such an opportunity emerged around the 3rd of March when the price started consolidating around the suggested support level at 1597. One key takeaway from this is to remember to be cautious whenever the market is consolidating after a major correction. As can be seen, the correction was followed by immense volatility outbursts, which threatened any premature long orders. Traders should have the mental stamina to watch their positions evolve over time, and not to succumb to the pressure of wanting to close them prematurely in order to protect the running profits.
Disclaimer: Your capital is at risk! Trading and investing on the financial markets carries a significant risk of loss. Each material, shown on this website, is provided for educational purposes only. A perfect, 100% accurate method of analysis does not exist. If you make a decision to trade or invest, based on the information from this website, you will be doing it at your own risk. Under no circumstances is Trendsharks responsible for any capital losses or damages you might suffer, while using the company’s products and services. For more information read our Terms & Conditions and Risk Disclaimer.


