Gold has advanced by over $500 per troy ounce since the beginning of the coronavirus crisis, as investors started feeling to low-risk securities amidst rising global uncertainty. Recently, the precious commodity even managed to cross above the psychologically significant threshold of $2000 temporarily, but then it retreated from the all-time high at $2074.
Ever since early-August, gold has been consolidating around this psychological barrier, with both bears and bulls weighing in on the next likely direction for one of the most popular safe-havens in the world. On the one hand, the bullish rally seems too solid to be terminated seemingly out of nowhere just now. On the other, the $2000 level represents an ideal turning point for gold's price, and for the development of an at least a minor bearish correction.
Breaking down the underlying fundamentals yields mixed results, as different traders continue to have diverging opinions of gold's new role in today's volatile markets. A case can be made that gold could resume climbing as a second coronavirus wave is likely to hit by the end of the year, potentially prompting even more investors to seek refuge in safe-havens. Nevertheless, such a second wave certainly will not have the same shock value as the initial blow in early-2020.
The global economic downturn has been severe but smaller compared to the initial forecasts. Even though the world economy is set on a road to bumpy and uneven recovery, there is plenty of evidence suggesting that the worse is over.
All of this implies that the scale of aggregate demand for gold is almost certainly going to change in the following months, which means that the price action is undoubtedly going to be affected as well. Whether or not gold's bullish run continues would depend mostly on how markets perceive the threat from a new downturn.
1. Long-Term Outlook:
As can be seen on the daily chart below, the price of gold is nearing the aforementioned psychological barrier at $2000 for a third time this month. The behaviour of the price action around it is going to shed more light on the next direction of the precious metal.
As regards the underlying bullish signals, there are several that require closer attention. Firstly, the price action managed to break out above the descending trend line in red, which implies strengthening bullish bias in the short-term. Secondly, the price of gold continues to trade above the three MAs, which represents an inherently bullish signal.
Thirdly and most significantly, the retracement from the historic resistance level at 2070.00 was stopped at the 23.5 per cent Fibonacci retracement level at 1927.95. The latter also has psychological importance as a potential turning point. A possible consolidation above this level would mean that the market bulls would retain control, possibly leading to a new attempt at continuing the bullish hike's development at a later stage.
As regards the underlying bearish signals, the 10-day MA (in red) recently crossed below the 30-day MA (in green). Even though these two continue to advance above the 50-day MA (in blue), the perfect ascending order has been broken. This could potentially signal waning bullish pressure in the market. Moreover, if the price action fails to break out above the crucially important psychological barrier at $2000 for a third consecutive time, this would undoubtedly prompt even more selling pressure from bears betting on a likely trend reversal.
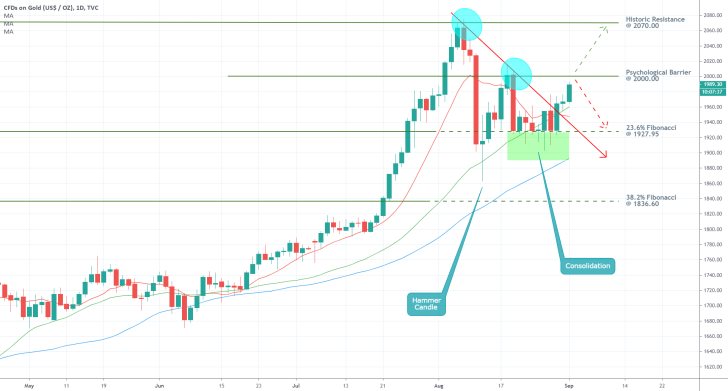
Depending on how the price action behaves around the $2000 level, this would illustrate the next most likely direction for its further development. The price action could either break this threshold and rally towards the historic resistance level at 2070.00 for another new attempt at setting a new all-time high, or it could consolidate in a tight range below the $2000 resistance and the 23.6 per cent Fibonacci retracement level at 1927.95.
2. Short-Term Outlook:
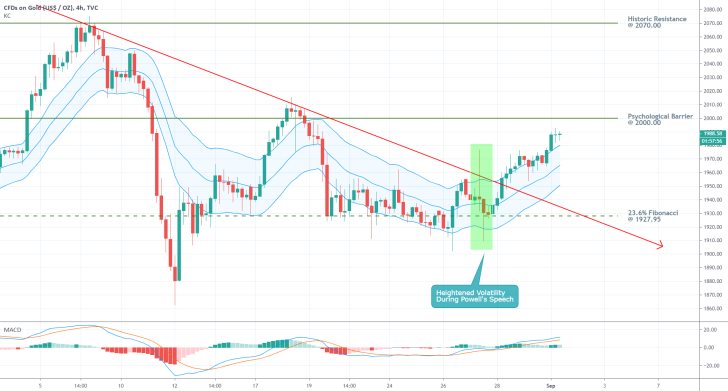
An examination of the price action's recent behaviour, further confirms the strong bullish bias in the short-term. As can be seen on the 4H chart below, gold continues to trade above the Keltner Channels indicator, which represents a strong bullish signal in itself. Moreover, the market appears to have already priced in the initial volatility that was created during the pivotal speech of FED Chair Jerome Powell last week. Not even this sporadic outburst of adverse volatility was significant enough to prompt a new breakdown below the 23.6 per cent Fibonacci.
As the underlying bullish momentum continues to rise, as demonstrated by the MACD indicator, the price action looks set to test the strength of the $2000.00 level one more time. Both bulls and bears are advised to wait and see the price action's further development afterwards before they place any orders.
Bears would be looking for indications of another failed attempt at a breakout. In contrast, bulls would be hoping for pieces of evidence demonstrating a decisive break of this psychological barrier, which would allow the continuation of the price action's hike afterwards.
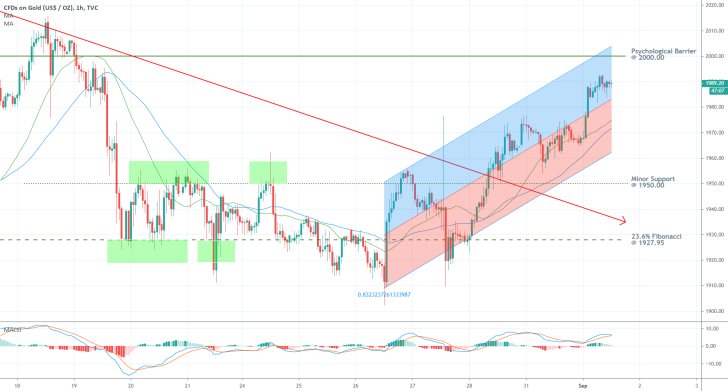
The hourly chart below demonstrates the development of gold's latest upswing. The price action is concentrated in the upper part of the ascending channel, which is a strong bullish signal. It also managed to decisively break out above the minor support level (previously resistance) at 1950.00 after several attempts. This is an attestation to rising bullish bias in the short-term.
After concluding a minor retracement, the price action also managed to rebound from the ascending channel's middle line as well as from the 30-day MA (in green). Both of these factors also confirm the strength of the underlying bullish sentiment.
Nevertheless, the MACD has been recording relatively flat waves – the latest waves have been incapable of rising above the preceding ones. This could be interpreted as an early indication of waning bullish momentum. A bearish crossover on the MACD just below the $2000 level could potentially signify a resurgence of bearish momentum in the short-term.
3. Concluding Remarks:
Due to the mixed fundamental factors currently affecting gold's price action and the massive interest that the precious metal garners amongst traders and investors, its price action could really go in either direction. As already stated, its behaviour around the psychologically important barrier at $2000 would represent the crucial piece of evidence that would almost certainly elucidate gold's next direction.
Meanwhile, expect heightened volatility this Friday when the Non-Farm Payrolls report is released in the US. Due to the inverse relationship between the greenback and the price of gold, the latter is also likely to be affected by the US labour market data for August. The consensus forecasts anticipate a fall in unemployment.
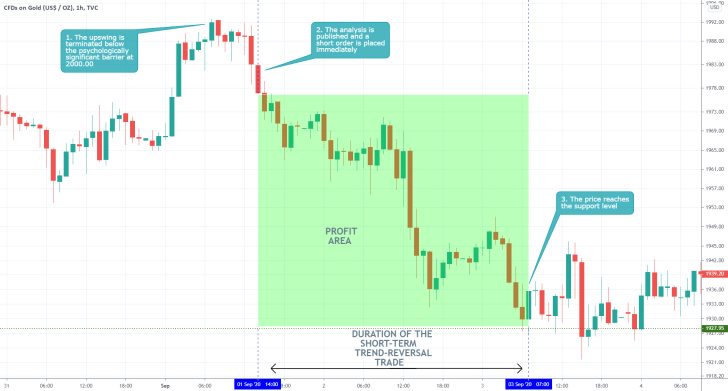
- The analysis was mostly correct in anticipating a correction towards the Fibonacci retracement level at 1927.95 on the condition of a rebound below the psychologically significant resistance level at 2000.00. Traders should be especially cautious and mindful of the behaviour of the underlying price action around such psychologically significant price levels, as they usually prompt changes in the direction of the price action.
Disclaimer: Your capital is at risk! Trading and investing on the financial markets carries a significant risk of loss. Each material, shown on this website, is provided for educational purposes only. A perfect, 100% accurate method of analysis does not exist. If you make a decision to trade or invest, based on the information from this website, you will be doing it at your own risk. Under no circumstances is Trendsharks responsible for any capital losses or damages you might suffer, while using the company’s products and services. For more information read our Terms & Conditions and Risk Disclaimer.


