The price of gold has been consolidating within a narrow range around the psychologically significant support level at the 38.2 per cent Fibonacci retracement since the expectations of our last analysis of the commodity were fulfilled. The reason for the temporary pause in the development of the recent downtrend is the FOMC meeting, which is scheduled to take place later today.
The overall trading activity diminished over the last several hours as gold traders are anticipating to see the outcome of the meeting, which could very likely affect the demand for safe-haven assets in the foreseeable future. Additional FED interventions into the underlying monetary policy would probably drive U.S. yields even lower, which would consequently have an adverse impact on the value of the dollar. This would also indirectly boost the price of gold due to the inverse relationship between the two.
Conversely, if the Federal Reserve abstains from altering its forward guidance later today, which is what we anticipate, its underlying QE programs would remain unchanged. This would be welcoming news for market bears eyeing the probable continuation of the downtrend's further development. These expectations are primarily substantiated by the fact that U.S. price stability has been improving steadily over the recent term, which is likely to be interpreted as a positive sign of recovery by the FED.
Meanwhile, vaccine rollout in the U.S. and elsewhere continues to support the general market excitement that has been observed over the last several weeks (a major reason for gold's depreciation so far into 2021). However, it remains to be seen whether this process would continue exerting the same type of influence in the near future.
Overall, the underlying fundamentals continue to seem slightly tilted in favour of the bears; however, this could promptly change in few hours when the FOMC is set to deliver its latest views on the current state of the U.S. economy.
1. Long-Term Outlook:
As can be seen on the daily chart below, the underlying technical outlook continues to be mostly bearish as well. After completing the 1-5 Elliott impulse wave pattern, which was highlighted in our previous analysis, the price action tumbled to the 38.2 per cent Fibonacci retracement level at 1836.28.
This corrective behaviour seems to be inlined with the establishment of an ABC pattern, as postulated by the Elliott Wave Theory. In other words, if the price action manages to break down below the Fibonacci support decisively, its next target-level would be the closest support level. In this case, this would be the 1780.00 support, which was established from the last swing low (at the dip of the 1-5 impulse wave pattern). Nevertheless, there is also a conceivable possibility for a bullish rebound from the current market price.
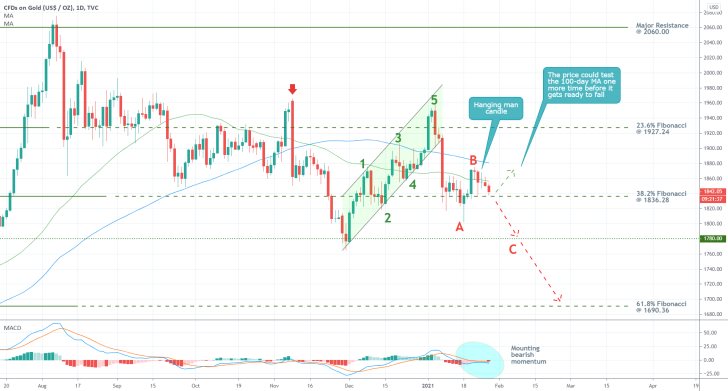
The price action is trading below the 50-day MA (in green), which is positioned below the 100-day MA (in blue). This is generally evocative of strong bearish pressure at present. Nevertheless, the price action is also consolidating in a tight range between the 50-day MA, which currently serves the role of a floating resistance, and the 38.2 per cent Fibonacci. As mentioned earlier, this subdued behaviour is taking place just a few hours ahead of the FED meeting, which signifies a bottleneck effect - the monetary policy statement is likely to catalyse a big price swing in either direction depending on FED's ultimate decisions.
Notice also that the underlying bearish momentum is currently rising, as demonstrated by the MACD indicator. Moreover, the development of a Hanging Man candle near the peak of the recent bullish pullback is also illustrative of this mounting bearish bias. Nevertheless, a sudden jump in buying pressure could drive the price action as high as the 100-day MA before the bears could attempt to regain control.
2. Short-Term Outlook:
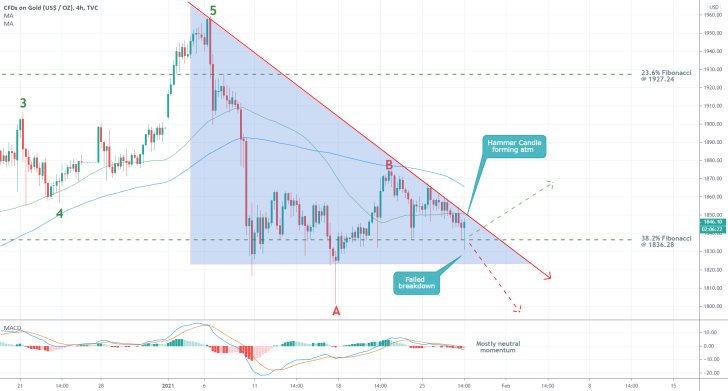
The above-mentioned bottleneck can be seen more clearly on the 4H chart below. Following the termination of the 1-5 impulse wave pattern (part of the subsequent ABC correction's development), the initial dropdown is represented as a major triangle structure. As the price action nears the lower-right angle of the triangle, it would have no other choice but to break out away from the triangle in either direction. This would, in turn, shed light on the next most likely path for the price action.
While this time, the MACD indicator is more neutral - once again due to the bottleneck effect - the price action's latest behaviour is more noticeably bearish. The simultaneous emergence of a false breakdown below the 38.2 per cent Fibonacci and a Hammer candle are both demonstrative of high uncertainty around this psychological support. In other words, the likelihood of bullish rebound developing next seems more plausible on the 4H than on the daily chart.
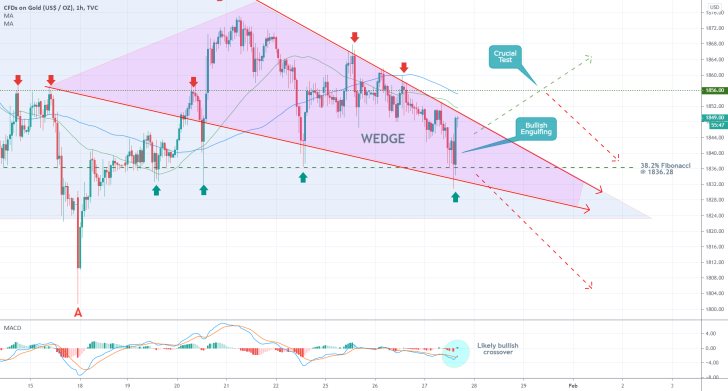
On the hourly chart below can be seen that the price action has also established a Wedge as a part of the above-mentioned bottleneck effect. This pattern typically indicates rising bullish bias, which affirms the expectations for the emergence of a bullish rebound next. This is further substantiated by the fact that following the false breakdown at point A, the price action has had an additional four failed tests of the 1836.28 support.
Seeing as how the price action established a bullish engulfing over the last hour, there appears to be an even stronger case to be made here for a likely bullish breakout above the triangle and the Wedge's upper border. The most significant test for such a breakout will be the minor resistance level at 1856.00, which has already held back the price action on five separate occasions (as indicated by the red arrows). The prominence of the resistance is further bolstered by the fact that the two moving averages are currently crossing below it.
Notice also that the MACD indicator appears to be in the process of recording a bullish crossover, which would very probably mean rising buying pressure in the short-term.
3. Concluding Remarks:
As was argued above, the continuation of the currently developing downtrend further down south depends on a decisive breakdown below 1836.28. That is why bears are advised against opening any short orders before such a breakdown occurs, especially ahead of the uncertain FED meeting. Instead, they should better wait for the expected upsurge in volatility from the event to subside before they even consider going short.
In contrast, bulls would also be taking a huge risk if they go long near the Fibonacci support ahead of the FOMC decision. They need a solid confirmation such as a breakout above the Wedge pattern. Additionally, it should be remembered that the final test of a bullish rebound would be at the 1856.00 minor resistance. A breakout above it would represent the confirmation needed by the bulls, whereas another bearish pullback from it would signal the bears that the broader downtrend may yet be resumed.
Gold Completes a Flag Pattern. New Downtrend Emerges
Gold's recent price consolidation seems to be finally concluded. The underlying price action is thus finally ready to resume falling, as per the expectations of the initial analysis.
The projected decrease in aggregate demand for the safe-haven asset, which is the primary reason for the price depreciation, is owing to several key factors. First of all, the adverse levels of uncertainty following the recent GameStop controversy are finally decreasing, which allows investors to once again focus on riskier securities. Consequently, WallStreet's attention is once again placed on the solid quarterly data that is being reported during the current earnings season.
Second of all, the market has already discounted the weaker-than-expected U.S. GDP data for Q4, which was the main cause for the development of the above-mentioned price consolidation. Moreover, FED's accommodative monetary policy driving U.S. yields to an all-time low right now is no longer causing investors' interest to be solely centred on low-risk securities.
The final blow for gold is expected to be delivered tomorrow when the U.S. labour market is projected to add 62 thousand new jobs. Hence, the price of the commodity is finally ready to resume falling, in line with the primary projections of our analysis.
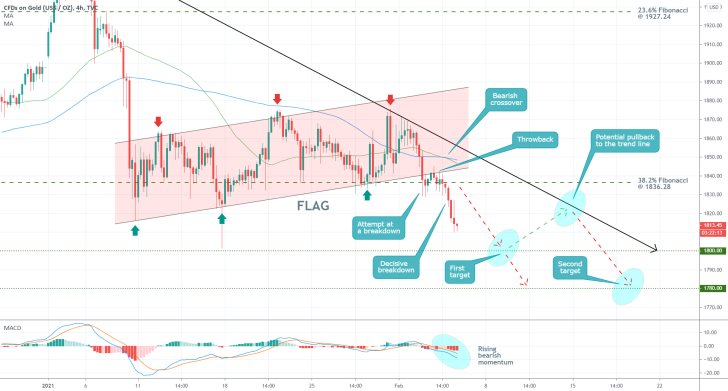
As shown on the 4H chart above, gold's price action finally managed to break down below the crucially important 38.2 per cent Fibonacci retracement level at 1836.28. The next two targets for the reinvigorated downtrend are the major support at 1800.00, which bears psychological significance, and subsequently, the major support at 1780.00.
The breakdown below the Flag pattern's lower boundary represents the most substantial indication that the price is ready to resume depreciating once again. The bearish crossover of the two moving averages - the 50-day MA (in green) crossing below the 100-day MA (in blue) - represents a secondary confirmation of the rising bearish pressure at present. Accordingly, the MACD indicator registered an upsurge in bearish momentum.
Bears should keep in mind that the price action already rebounded from the 1800.00 support once, which is why another abrupt pullback is plausible. The price action could retrace back to the descending trend line before the bearish sentiment is reinstated. Even if this were to happen, market bears would have an opportunity to add to their short orders by selling at the resulting peak.
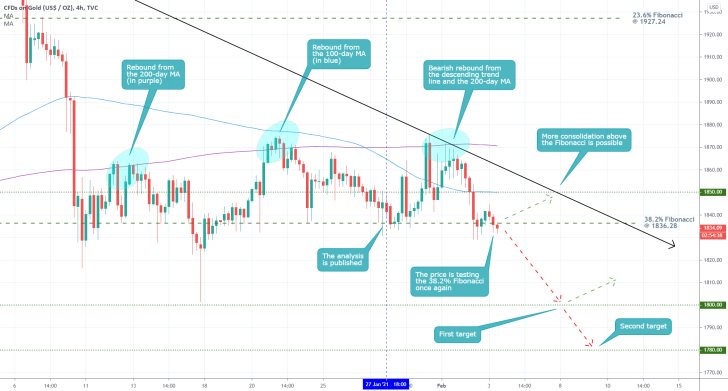
- Shortly after the publication of the analysis, the price shot up towards the 1860.00 resistance. Owing to the fact that the possibility for such a rebound was outlined in the analysis negated the overall risk.
- Seeing as how the bullish pullback was terminated below the descending trend line (in black) and the 200-day MA (in purple), the longer-term expectations remain bearishly oriented. The price action is currently testing the 38.2 per cent Fibonacci retracement yet again. If it manages to break down below it, the target levels for the resumed downtrend will remain the same - the psychological support at 1800.00, followed by the major support at 1780.00.
- However, the price action is also likely to continue consolidating in the near future. It could rebound towards 1850.00 yet again to test the descending trend line converging with the 100-day MA (in blue).
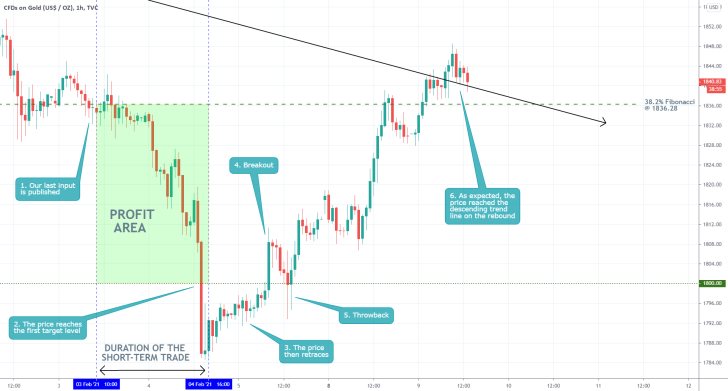
- As anticipated, the price action eventually broke down below the 38.2 per cent Fibonacci retracement level at 1836.28, and then tumbled to the psychologically significant support level at 1800.00. Subsequently, the price action rebounded and corrected the incurred losses by retracing back to the 38.2 per cent Fibonacci and the descending trend line.
- In addition to the successful projections for a dropdown to 1800.00, the second-best aspect of the analysis' follow-up was its precise expectations for such a bullish retracement.
- Traders need to keep in mind that such psychologically significant support and resistance levels typically serve as potential turning points for the underlying direction of the price action.
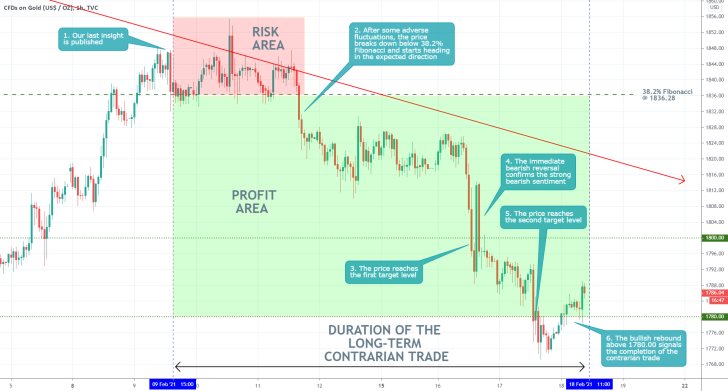
- Our gold analysis garnered an additional 55.55 dollars from Gold's downswing. The projections of the last follow-up analysis were realised since the price action rebounded from the descending trend line (in red) and headed towards 1780.00.
- Overall, the analysis caught 91 dollars from gold's price fluctuations in 22 days. The biggest takeaway from this is the importance of patience and belief in one's reasoned expectations. A successful trader has his eyes on the big picture, has the patience to see the market setup unfold, and does not make any spontaneous and premature decisions that could jeopardise the performance of the trade.
Disclaimer: Your capital is at risk! Trading and investing on the financial markets carries a significant risk of loss. Each material, shown on this website, is provided for educational purposes only. A perfect, 100% accurate method of analysis does not exist. If you make a decision to trade or invest, based on the information from this website, you will be doing it at your own risk. Under no circumstances is Trendsharks responsible for any capital losses or damages you might suffer, while using the company’s products and services. For more information read our Terms & Conditions and Risk Disclaimer.


