The price of gold is currently probing the psychologically significant resistance level at 1800.00, which might prove to be an impregnable obstacle, at least for the time being. There is a confluence of mounting bearish indications, all pointing to a likely upcoming reversal from this threshold, which means bears can try to implement contrarian trading strategies.
As of late, there has been heightened demand for higher-yield assets, driven by Bitcoin's rally. Consequently, lower-risk securities, including the safe-haven gold, are likely to be pressured by mounting selling pressure. This discrepancy is fuelled by mixed economic data that has been observed recently. Meanwhile, the quarterly earnings numbers of some of the biggest technology companies in the U.S. this week are likely to bolster this underlying trend.
The broader market sentiment, however, is less clear cut. As it is about to be seen, the price action appears to be consolidating between the boundaries of a broad range. This means that all trading orders should be structured in accordance with the boundaries of said range.
Drawing the Boundaries of the Broader Range
As can be seen on the daily chart below, the price action appears to be consolidating between the 23.6 per cent Fibonacci retracement level at 1736.73 and the 61.8 per cent Fibonacci at 1826.56. The 38.2 per cent Fibonacci at 1771.06 serves as an intermittent boundary.
The latest rebound from the lower limit of the range is represented as an ascending channel (in green). The question is whether the price action would remain concentrated within the channel as it heads towards the upper limit of the range next, or would there be an intermittent dropdown to the 38.2 per cent Fibonacci beforehand.
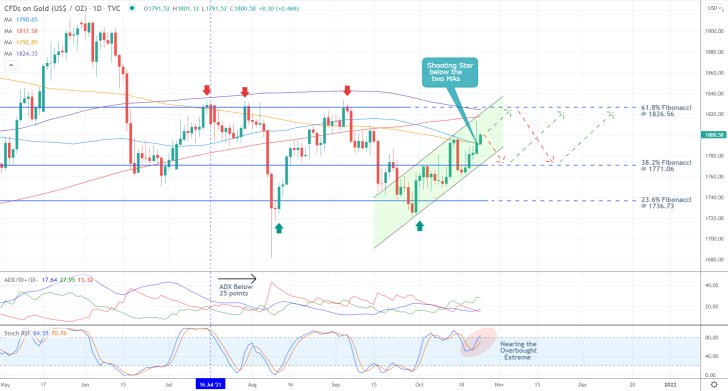
First off, it is important to point out the strength of the underlying range. The ADX indicator has been threading below the 25-point benchmark since the 16th of July, which underscores the weak market commitment. Under these conditions, the price action is likely to continue bouncing off from the borders of the range. Notice also that the Stochastic RSI indicator is threading near its overbought extreme. This signifies the likelihood of an upsurge in selling pressure in the near future.
The 300-day MA (in purple) and the 400-day MA (in red) are currently converging towards the 23.6 per cent Fibonacci, making it an even more prominent turning point.
Even more interestingly, last week's trading session was concluded with the development of a Shooting Star candle. Its body was closed below the crossover between the 200-day MA (in orange) and the 100-day MA (in blue).
This possibly represents an early indication of a bearish reversal below the 23.6 per cent Fibonacci. This would largely be depending on the subsequent behaviour of the price action around the psychologically significant resistance level at 1800.00.
Observing the Psychological Barrier
The latest upswing, the one represented by the ascending channel, appears to be taking the form of a 1-5 impulse wave pattern, as postulated by the Elliott Wave Theory. This can be seen on the 4H chart below.
The second impulse leg of the structure (2-3) resulted in the establishment of a fakeout above the psychological resistance at 1800.00. Given the significance of the latter as a major turning point, the price action looks poised to begin developing the second retracement leg (3-4) immediately.
Such a dropdown is likely to bottom out around the lower limit of the ascending channel. Notice that this is where the 300-day MA (in purple) and the 50-day MA (in green) are currently converging. It follows that the second retracement leg (3-4) from the psychological resistance level at 1800.00 is likely to fall towards the major support level at 1780.00.
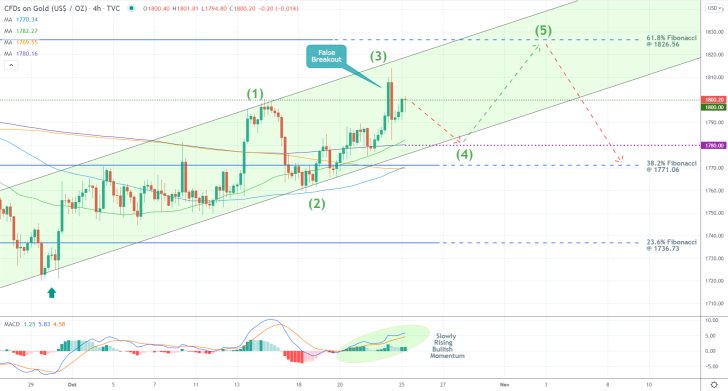
A deeper dropdown could potentially reach the 38.2 per cent Fibonacci retracement level due to its close proximity to the 1780.00 support. The latter is currently converging with the 100-day MA (in blue) and the 200-day MA (in orange), making it an even more prominent turning point.
At any rate, the (3-4) retracement leg is likely to bottom out between either of the two supports before the third impulse leg (4-5) can drive the price action towards the 23.6 per cent Fibonacci (upper border of the range).
It is also worth pointing out that the underlying momentum continues to be prevailingly bullish-oriented, as underscored by the MACD indicator. That is why bears should not rush to sell at 1800.00 at all costs, as there could be additional adverse fluctuations above it before the (3-4) retracement leg can commence developing.
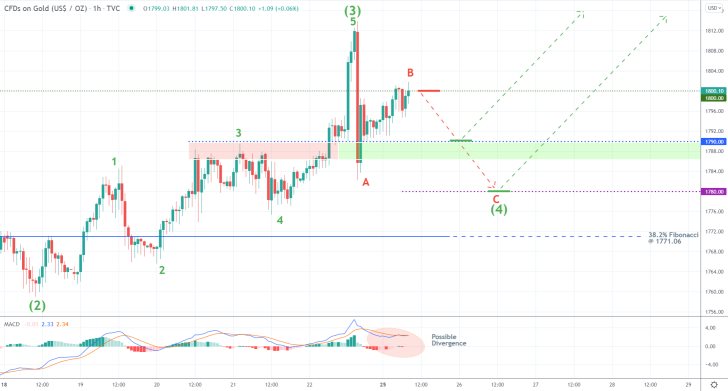
As can be seen on the hourly chart below, things look slightly more different in the short term, particularly with regards to momentum. This time, the MACD highlights an early indication of a divergence in the making. This reading is congruent with the expectations for a reversal from the psychological resistance at 1800.00.
Due to the scalability of the price action, it can be asserted that the second impulse leg (2-3) of the Elliott structure is itself comprised as a 1-5 impulse pattern. Logically it follows that the (3-4) retracement leg would be structured as an ABC correction. Given that the AB pullback currently struggles below the psychological resistance at 1800.00, the likelihood of a BC dropdown towards 1780.00 seems to have increased.
However, bears and bulls should watch out for the behaviour of the price action around the resistance-turned-support at 1790.00, as this level could possibly prevent deeper corrections.
Concluding Remarks
Bears looking to sell around 1800.00 should not place their supporting stop-loss orders more than $6 away from their initial entries. Once the price action draws near the 1780.00 support level, they could substitute their fixed stop orders for floating TPs to protect themselves from snap bullish rebounds.
Accordingly, bulls can place long limit orders at 1780.00 on the expectations for a subsequent pullback towards the 61.8 per cent Fibonacci at 1826.56. Their supporting stop-loss orders should not be placed below the 38.2 per cent Fibonacci.
Textbook Trading Setup on Gold
The price action of gold has been behaving in a predictable way over the last couple of weeks without establishing many adverse fluctuations that seem out of context. The Elliott Wave Theory can therefore be utilised to a great effect to project the likely future twists and turns of the price action.
Gold was somewhat sidelined in the wake of the latest earnings season in the U.S. as the robust performance of Big Tech prompted heightened investors optimism. This led to diminished demand for lower-risk securities. However, things might change in the very near future.
The Federal Open Market Committee (FOMC) of the FED is meeting later today, and many experts expect to see more hawkish hints in the rhetoric of Jerome Powell, Chairman of the Federal Reserve, and his colleagues. If the Committee expounds upon the inroad to dialling back its monetary support, this would likely reinvigorate the demand for safe-havens.
This is why the current setup on gold entails the possibility of going long at the latest dip.
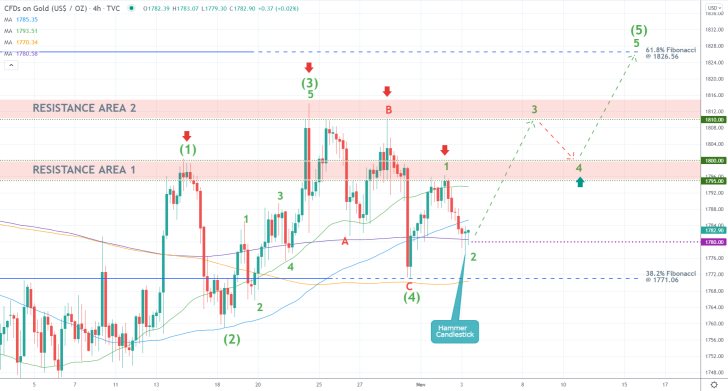
As can be seen on the 4H chart above, the price action appears to be developing a massive 1-5 impulse wave pattern. And due to its scalability, each impulse and retracement leg appears to be comprised of smaller Elliott wave structures. It is precisely this fractal nature of the price action that allows us to forecast likely future impulses and retracements.
The first impulse leg (0-1) underpinned the significance of Resistance Area 1, which spans between the major resistance at 1795.00 and the psychologically significant threshold at 1800.00. The second impulse leg (2-3) did the same for Resistance Area 2, spanning between 1810.00 and 1815.00.
The second retracement leg (3-4) was completed recently at the 38.2 per cent Fibonacci retracement level at 1771.06. The latter is currently being crossed by the 200-day MA (in orange). Presently, the price action is in the process of developing the final impulse leg (4-5).
Its own first impulse leg (0-1) peaked at Resistance Area 1. The subsequent retracement leg (1-2) appears to be terminated around the major support level at 1780.00, which is underpinned by the 300-day MA (in purple). This is where bulls can look for an opportunity to go long.
The emergence of a Hammer Candlestick at the supposed dip of the (1-2) retracement leg confirms that the price action is indeed due for another bullish rebound.
If the second impulse leg (2-3) manages to break out above the 100-day MA (in blue) and the psychological resistance at 1800.00, it is likely to then head towards the lower limit of Resistance Area 2 at 1810.00. This is where bulls can collect their running profits, while bears can place short orders on the expectation for a subsequent dropdown to the psychological threshold from above.
Bulls can once again enter long at 1800.00 - what is expected to be then the dip of the second minor retracement leg (3-4)- before the price action starts developing the final impulse leg (4-5). It is then likely to climb towards the 61.8 per cent Fibonacci at 1826.56.
The supporting stop-loss orders should not exceed $10 from the initial entry of every trade.
Gold Likely to Reverse from the 61.8% Fibonacci Retracement
There are mounting bearish indications that the price of gold may be due for a correction next. The price action had appreciated to a major resistance level recently, which seems like the most suitable place to look for signs of an imminent dropdown.
The latest upsurge was caused following the November policy rate decision of the Federal Open Market Committee (FOMC), which announced plans to start tapering its asset purchases from December.
With liquidity set to be scaled back, investors would have fewer incentives to enjoy such easy profits in the stock market from here on out. This is why they are likely to start looking more to lower-risk securities in the medium term, which is where the recent upsurge in demand for gold came from.
Nevertheless, this transformational change in the underlying market sentiment does not preclude the possibility of sudden corrections occurring in the short term. In fact, the U.S. PPI and CPI inflation numbers that are scheduled for publication over the next couple of days could turn out to be the catalysts for such dropdowns.
The current setup is thus suitable for the implementation of contrarian trading strategies just below the closest resistance level. More risk-averse traders should keep in mind that those would entail a higher degree of risk, which is why they should consider carefully whether they would like to take advantage of the current opportunity or not.
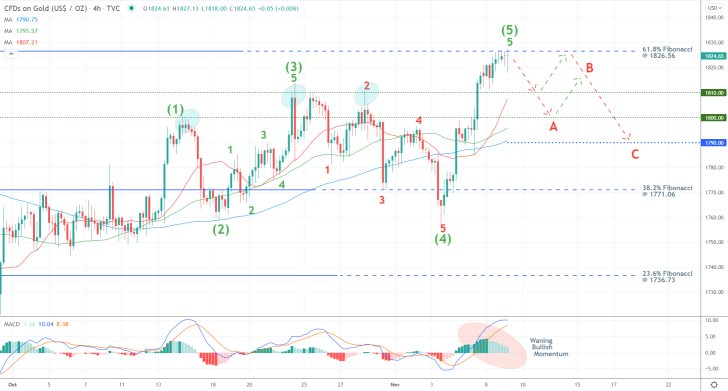
As can be seen on the 4H chart above, the price action appears to have just concluded a major 1-5 impulse wave pattern, as postulated by the Elliott Wave Theory, just below the 61.8 per cent Fibonacci retracement level at 1826.56. The price action has been consolidating just below this threshold for the last several hours, and bears should consider entering short here, provided that the price does not break out above the 61.8per cent Fibonacci.
This is further substantiated by the fact that the declining histogram of the MACD indicator is currently underpinning waning bullish momentum. This is congruent with the expectations for a divergence currently in the making.
The anticipated correction itself is likely to take the form of an ABC pattern. The first impulse leg (0-A) is likely to bottom out either at the previous swing peak (at 1810.00) or the psychologically significant threshold at 1800.00. Following the intermittent retracement leg (AB), the third impulse leg (BC) is likely to then head towards the 1790.00 support level. The latter is currently underpinned by the 100-day MA (in blue).
Bears who decide to enter short around the current spot price should utilise very narrow stop-loss orders. They should not exceed more than $10 above their initial entries.
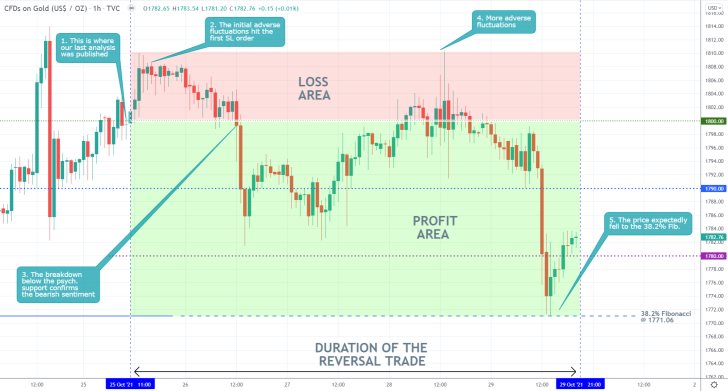
- Our last analysis of gold successfully forecasted a dropdown to the 38.2 per cent Fibonacci retracement level at 1771.06. However, adverse fluctuations triggered the stop-loss order above the psychological level at 1800.00 on two occasions before that.
- This is a good example of how adverse volatility tends to increase around such important thresholds. That is why contrarian traders need to be resilient, as sometimes they might have to place several trades before they gain a favourable entry.
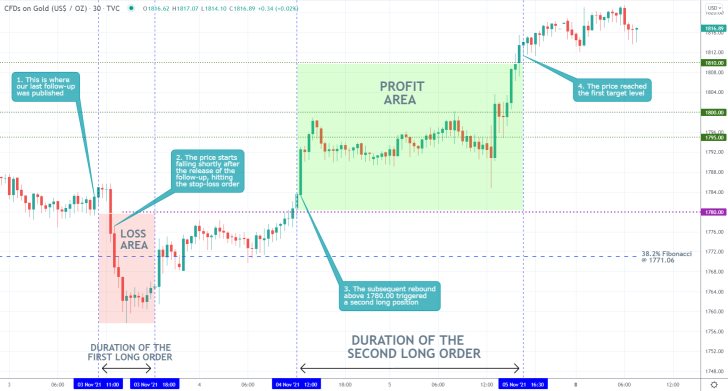
- Shortly after the publication of our last gold follow-up, the price action broke down below the 1780.00 support level. The subsequent dropdown penetrated even below the 38.2 per cent Fibonacci retracement level at 1771.06. This triggered the stop-loss order of the trade.
- However, the following rebound above 1780.00 signalled the execution of another long order. The price action then went on to climb to the first target level at 1810.00.
- This is a good example of why traders need to maintain their composure, as they might have to execute several trades before they gain a favourable entry.
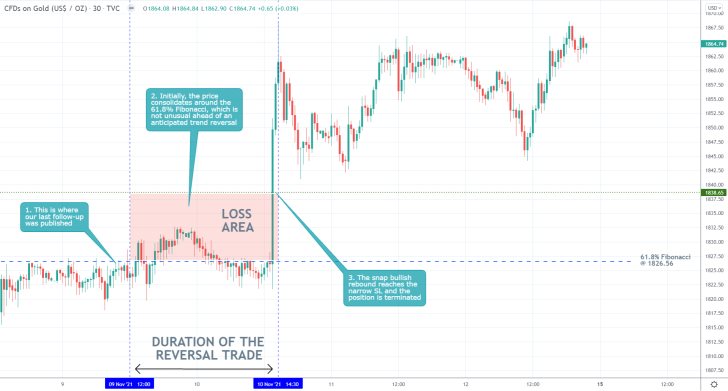
- The expectations of our last analysis of gold were not realised. A trend reversal did not occur from the 61.8 per cent Fibonacci retracement level at 1826.56.
- Instead, a decisive bullish breakout occurred above this major threshold, which triggered the stop-loss order that was placed $10 above the resistance.
- This is a good example of why one needs to place narrow SLs above/below major thresholds when utilising contrarian trading strategies.
Disclaimer: Your capital is at risk! Trading and investing on the financial markets carries a significant risk of loss. Each material, shown on this website, is provided for educational purposes only. A perfect, 100% accurate method of analysis does not exist. If you make a decision to trade or invest, based on the information from this website, you will be doing it at your own risk. Under no circumstances is Trendsharks responsible for any capital losses or damages you might suffer, while using the company’s products and services. For more information read our Terms & Conditions and Risk Disclaimer.


