The price of Gold is headed towards a multi-month high as demand ramps up in the short term. Traders and investors are sizing up the impact of inflation growth on the pace of U.S. recovery, which is already being reflected in the commodities market.
All eyes are currently focused on the upcoming non-farm payrolls data, which is likely to bolster these inflation pressures. In particular, a potentially robust jobs report on Friday would likely strengthen the price of gold, as the market would perceive this as an indication of sustained economic stabilisation.
At any rate, Friday's payrolls numbers are likely to boost volatility in the lead-up to the report's publication, as traders' anticipation grows. Given that the price of the commodity is already drawing near to a major threshold, these fundamental factors entail good trading opportunities for bulls and bears alike.
The Next Make-it-or-Break-It Threshold
The price of gold has been establishing a new uptrend since April after having completed a major downtrend, as shown on the daily chart below. The termination of the latter was underpinned by the completion of a broad 1-5 impulse wave pattern, as postulated by the Elliott Wave Theory.
The strength of the new uptrend, in contrast, can be inferred from the fact that the price was able to break out above the 23.6 subsequently and the 38.2 per cent Fibonacci retracement levels. And it is currently drawing near to the last Fibonacci barrier - the 61.8 per cent at 1917.50.
In addition to the aforementioned fundamentals, volatility is also likely to increase because of the fact that the price is coming close to such a psychological barrier. Depending on the more intricate developments in the short term, both bulls and bears can take advantage of these expected fluctuations.
While probing the 61.8 per cent Fibonacci, the price of gold is likely to bounce between the major support level at 1875.00 and the major resistance at 1950.00. The significance of the latter is derived from the fact that the level has already served as a major threshold on two separate occasions (underscored by the emergence of the two swing peaks). These are the two immediate levels that are going to be targeted by bulls and bears, respectively.
The strong underlying volatility is illustrated by the widening Bollinger Bands indicator. Notice that the upper band is threading just above the 61.8 per cent Fibonacci, making the latter an even more prominent resistance. That is so because the uptrend has been advancing below the upper band of the indicator since its inception. This makes the emergence of a temporary correction from 1917.50 seem more plausible.
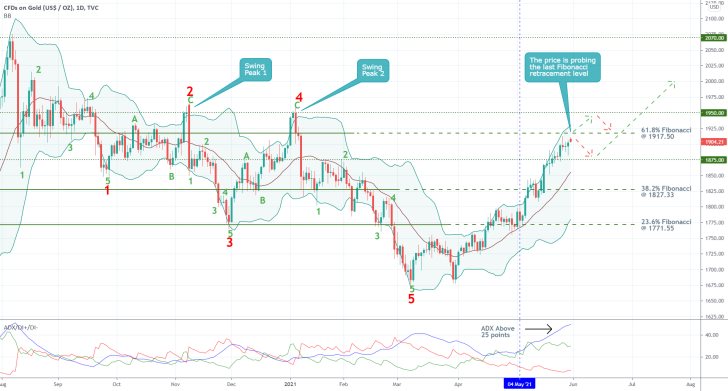
Notice also that the ADX indicator has been threading above the 25-point benchmark since the 4th of May. This underlines the strength of the bullish commitment in the market and implies the likely continuation of the uptrend's progression in the long term. Nevertheless, this does not preclude the possibility for the emergence of a bearish correction in the short term.
The deepest that such a correction could fall to, it seems, is 1875.00, as stated earlier. This assertion is further substantiated by the fact that the middle band (the 20-day MA) is about to converge with this support level.
Repeating Patterns
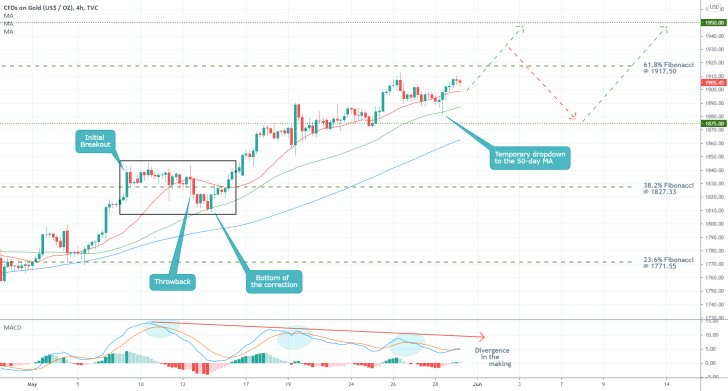
As can be seen on the 4H chart below, the behaviour of the price action around the previous Fibonacci barrier could serve as an example of how the price is likely to behave around the 61.8 per cent mark.
Notice the rectangle underpinning just that from the time when the price of Gold was probing the 38.2 per cent Fibonacci retracement at 1827.33. Following the initial breakout, the price sunk below the 20-day MA (in red). Subsequently, a throwback to the 50-day MA (in green) was also established. That is where the correction bottomed out, and a successful rebound occurred next.
Similar behaviour can be expected to be observed around 1917.50, especially given the fact that a divergence appears to be in the making. This is underpinned by the MACD indicator, signifying the likelihood of a minor correction.
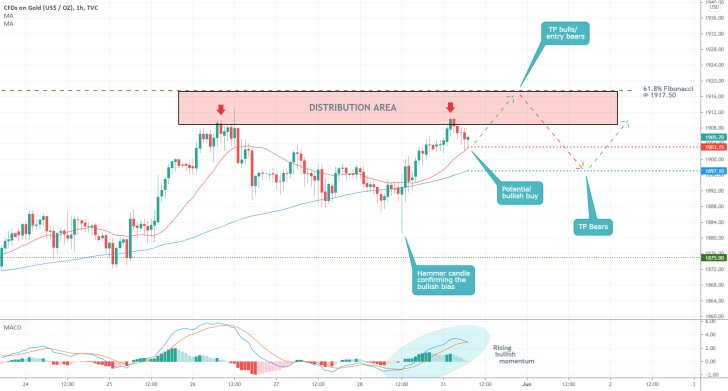
Looking at the hourly chart below, the MACD indicator is currently underlining peaking bullish momentum, which could be a precursor to a subsequent dropdown. Even still, the latest upswing may yet climb a little bit further, conceivably to 1917.50. This is inferred from the fact that it was initiated from the 100-day MA (in blue), leaving in its wake a Hammer candle.
At any rate, both bulls and bears need to observe the behaviour of the price action within the Distribution Area (in red) carefully. Since it is positioned just under the 61.8 per cent Fibonacci, this is where a correction is most likely to emerge from, though false breakouts above it are also plausible.
Concluding Remarks:
For bulls, the associated risk of joining the market at the present rate is measurably bigger than the underlying risk of placing a short order. That is so because bulls would be joining an existing trend just below a major resistance. Nevertheless, they could still buy into the trend, but they need to implement very tight stop-losses (just below the 20-day MA) and take-profits. As stated earlier, the short term target is 1917.50.
As regards bears, they could wait for the price to climb to the Fibonacci barrier before they sell the price of gold. Their first target is underscored by the 100-day MA, at 1897.00. This level is positioned just below the psychologically significant support at 1900.00, making it a likely reversal point.
If the price manages to break down below 1897.00 decisively, bears could move their stop-losses to a breakeven level with the intent to catch a deeper correction. By doing so, they would limit their potential losses by protecting themselves against sharp bullish rebounds while keeping their positions active in case that the correction were to drop to the lower end at 1875.00.
Bearish Pressure on the Price of Gold Intensifies
The bearish reversal that was projected by the initial analysis has occurred. Now, there is mounting selling pressure on the price of gold, which means that market bears can now trade on the expectations for continued price depreciation.
In anticipation of the release of the May Non-Farm Payrolls in the U.S. later today, the price has consolidated in the very short term. The latest employment data looks poised to catalyse the next big movement on the price of the commodity.
The consensus forecasts are anticipating very solid employment numbers for last month, which would likely strengthen the dollar. Consequently, this is expected to have an adverse impact on gold, exacerbating the recent selloff.
Investors' interest in safe-havens is waning amidst improving industry conditions in the U.S. Demand for crude oil and other commodities remains high, which is fuelling the selling pressure on gold, as the general appeal of the king safe-haven is falling because of these recent developments.
Hence, all underlying fundamental factors seem to be pointing to the same likely conclusion - gold's recently emerged downtrend is only likely to continue developing in the foreseeable future.
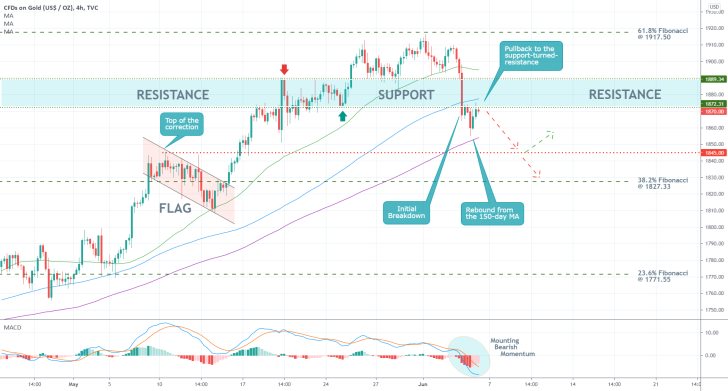
The underlying technical outlook is prevailingly bearish as well, as demonstrated by the MACD indicator. As can be seen on the 4H chart above, the first major bearish development was encapsulated by the decisive breakdown below the support-turned-resistance (in blue) area's lower boundary at 1870.00.
This breakdown also managed to penetrate below the 100-day MA (in blue), which represented an important floating support. Afterwards, the price rebounded from the 150-day MA (in purple), initiating a minor bullish pullback.
This offers bears an excellent opportunity to add to their selling orders at the resulting peak of the pullback. This peak is currently taking the form of a temporary consolidation of the price below 1870.00, as well as below the 100-day MA.
Thus, bears can sell at the current market price, though they should keep in mind that any surprise results on the NFP could cause a sharp upswing north. That is why they need to place their stop-losses just above the 100-day MA. That way, they can protect themselves against the uncertainties associated with proactive trading (before major economic releases).
The first major target for such a markdown is encapsulated by the support level at 1845.00. It is considered a prominent price level because of its previous role as a peak of a major correction on the preceding uptrend. The next psychologically significant target level is underpinned by the 38.2 per cent Fibonacci retracement level at 1827.33.
Gold to Continue Falling as the Pace of Inflation Growth Eases
The price of gold has started to depreciate, which can be determined by the fact that it has begun developing consecutively lower swing peaks - (5) is positioned above the corrective (B) on the 4H chart below.
Bearish market sentiment is only likely to increase in the near future as inflation concerns take the spotlight. The U.S. CPI data for May, which is scheduled for publication later today is likely to propel the price of the commodity lower.
That is so because the rate with which consumer prices increase is expected to have slowed down last month, similarly to what is already being observed globally. This would favour the stabilisation of the greenback in the short term and weigh down on riskier assets.
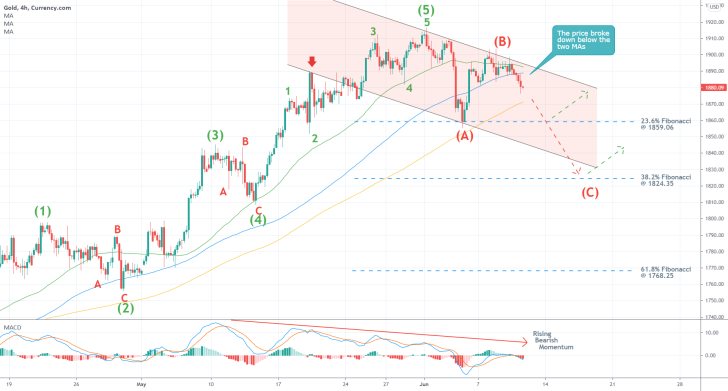
The price action has already completed a major 1-5 impulse wave pattern, as postulated by the Elliott Wave Theory, which is likely to be followed by an ABC correction. What is interesting is that the bottom at (A) was established at the 23.6 per cent Fibonacci retracement level before the price rebounded towards (B).
Seeing as how (B) has already peaked at the upper boundary of the channel, the subsequent dropdown towards (C) is likely to reach the 38.2 per cent Fibonacci retracement level at 1824.35. In addition to retracing from the upper limit of the channel, the price action also penetrated below the 50-day MA (in green) and the 100-day MA (in blue), which represents another major bearish indication.
The MACD indicator illustrates rising bearish momentum, which is to be expected if the price action is indeed to continue establishing the ABC correction.
If the price of gold manages to penetrate below the 150-day MA (in orange), then it would be cleared to continue depreciating towards the lower end of the channel. Bears should also be aware of potential rebounds from the 23.6 per cent Fibonacci, which would terminate the selling opportunity right there.
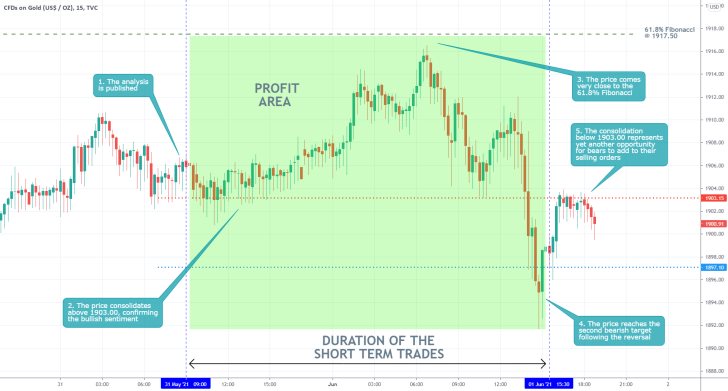
- The price of Gold behaved exactly as expected. Initially, it rose to the 61.8 per cent Fibonacci Retracement level (though it reversed slightly below it) in a final bullish attempt. Then, an anticipated bearish reversal took place.
- The takeaway here is that the price action can sometimes change its underlying direction sharply when it nears major support or resistance levels, or at any rate, price levels of psychological importance.
- The current consolidation of the price action below the support-turned-resistance level at 1903.00, which is positioned very close to the psychologically significant support at 1900.00, signifies rising bearish sentiment in the market.
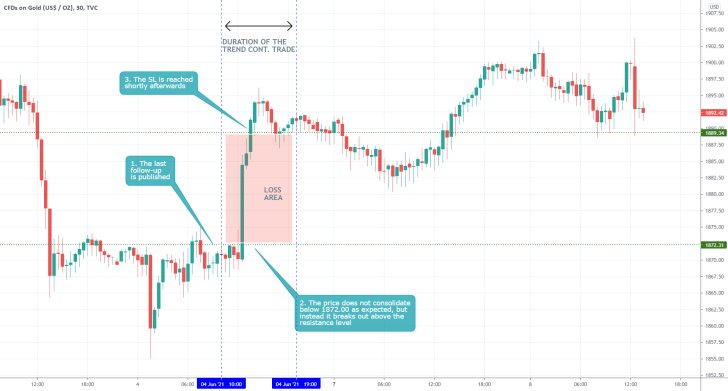
- The expectations of the last follow-up were not realised at all because the price started appreciating almost immediately after its publication.
- That is why traders have to place very narrow stop-loss orders when selling at something that looks like a peak of a recent pullback.
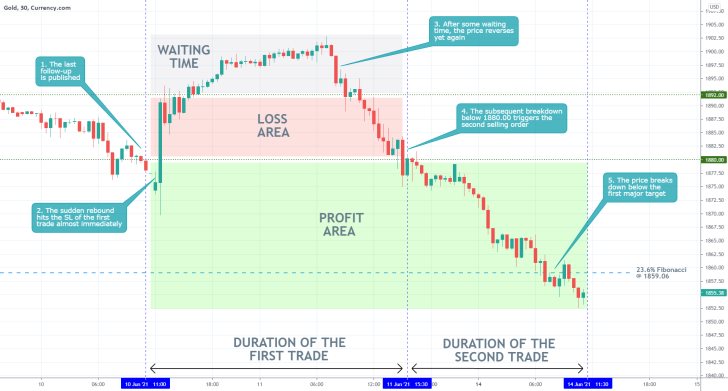
- Despite some initial hurdles, the price of gold eventually did fall to the 23.6 per cent Fibonacci retracement level, as projected by our last follow-up analysis of the commodity. However, the execution of two trades was necessary because of the fakeout above 1892.00.
- This is a good example of why traders need to have a strong mentality and patience. Sometimes the execution of several failed trades is needed before one can catch the big movement.
Disclaimer: Your capital is at risk! Trading and investing on the financial markets carries a significant risk of loss. Each material, shown on this website, is provided for educational purposes only. A perfect, 100% accurate method of analysis does not exist. If you make a decision to trade or invest, based on the information from this website, you will be doing it at your own risk. Under no circumstances is Trendsharks responsible for any capital losses or damages you might suffer, while using the company’s products and services. For more information read our Terms & Conditions and Risk Disclaimer.


