The price action of gold looks poised to climb higher in the near term after the commodity was able to recover from last week's upsurge in adverse volatility, which was prompted by the top-tier economic releases towards the end of the week. Therefore, bulls have a chance to enter at a discount by implementing trend-continuation strategies.
The price action attempted to break lower following the publication of the better-than-expected non-farm payrolls for January, though it was then able to recover promptly. The monetary policy decisions of the ECB and BOE contributed to this temporary upsurge in volatility.
The clear absence of many top-tier economic releases in the calendar for this week would likely lead to diminished levels of trading activity. The resulting drop in liquidity, in turn, would be good news for gold, as the overall probability of additional volatility outbursts occurring over the next five days would likely diminish.
Overall, the price action of the commodity continues to be ostensibly range-trading, which is something that traders need to consider before they join the market. Chiefly, bulls should attempt to enter long near the dip of the range.
Confirming the Range-Trading Environment
As can be seen on the daily chart below, the massive consolidation range spans between the 23.6 per cent Fibonacci retracement level at 1860.58 and the 61.8 per cent Fibonacci at 1769.09. At present, the price action is concentrated roughly around the middle portion of the range and the ascending channel, which means that traders should be particularly careful with their trade execution.
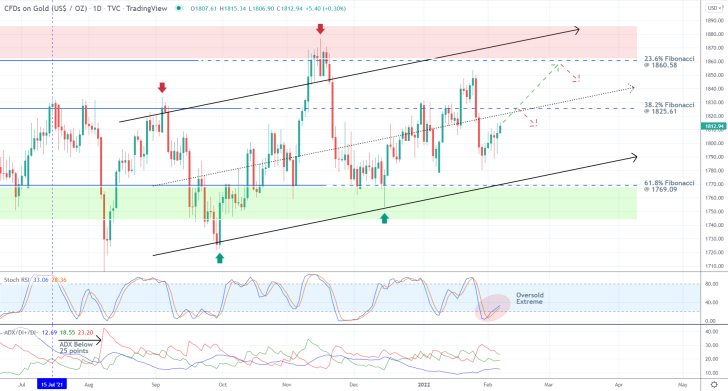
The 38.2 per cent Fibonacci at 1825.61, which is currently being crossed by the middle line of the ascending channel, represents the most significant obstacle for the price action around the middle section of the range. A decisive breakout above the two would thus confirm the probable continuation of the upswing towards the upper limit of the channel. However, failing to do so would probably result in another correction.
Notice that the ADX indicator has been threading below the 25-point benchmark since the 15th of July, highlighting the strong range-trading conditions on the market. Meanwhile, the Stochastic RSI is once again demonstrating rising buying pressure after having fallen to the oversold extreme recently. Both factors seem to corroborate the expectations for a breakout above the 38.2 per cent Fibonacci.
Finally, the latest pullback, which has been developing over the past couple of weeks, is comprised of candlesticks with massive lower shadows. This implies very strong buying pressure above the psychologically significant support level at 1800.00. This further confirms the underlying expectations for another rebound towards the upper limit of the broader range.
The Major Support and Resistance Levels to Keep an Eye On
As regards the shorter term, the price action is currently attempting a breakout above the support-turned-resistance level at 1810.00, as shown on the 4H chart below. Bulls can use this major threshold as an indication of whether the underlying bullish commitment will persist in the near future.
The significance of the latter is further substantiated by the fact that the 200-day MA (in orange) and 400-day MA (in red) are both converging with it. Meanwhile, the 100-day MA (in blue), underscoring the resistance at 1817.70, signifies the only intermittent obstacle before the 38.2 per cent Fibonacci. On the other hand, the 300-day MA (in purple), elucidating the support at 1803.50, adds to the strength of the aforementioned psychological support.
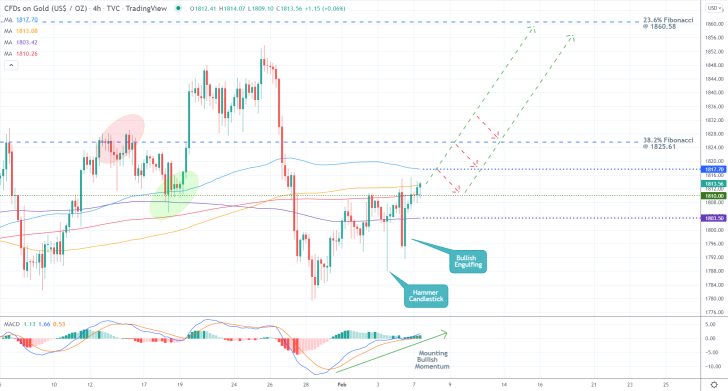
The development of a Hammer candlestick and a Bullish Engulfing, both closing above the 300-day MA, also signifies the strong buying pressure just above the 1800.00 threshold. Given that these occurred while the underlying bullish momentum was rising steadily, as highlighted by the MACD indicator, it also corroborates the primary expectations.
Overall, the current upswing is likely to head towards the 23.6 per cent Fibonacci, though bulls should be on the lookout for potential dropdowns from the 100-day MA and around the 38.2 per cent Fibonacci.
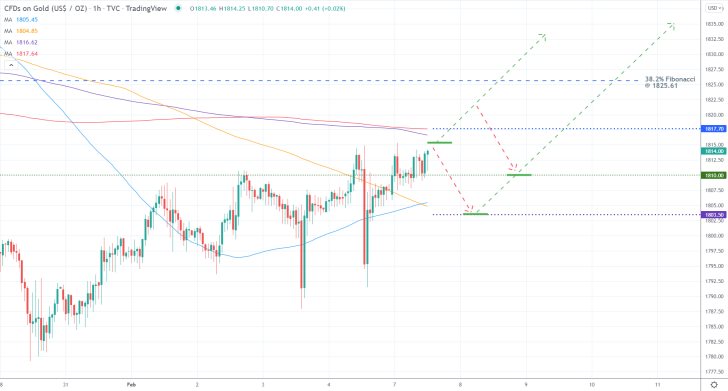
As shown on the hourly chart below, the crossover between the 100-day MA and 200-day MA is threading near the 1803.50 level, making it an even more prominent support. Meanwhile, the 300-day and 400-day MAs converge with the 1817.70 resistance to the same effect.
Concluding Remarks
Bulls can consider entering long either at the current spot price (around 1815.00-1820.00) or do so after the next pullback - by placing long limit orders either at 1810.00 or 1803.50. In the first case, their supporting stop-loss orders should be placed just below the 1810.00 support level. In the latter, their SLs should not be placed deeper than $6 from their initial entries.
As stated earlier, the ultimate target would be the upper limit of the range at the 23.6 per cent Fibonacci at 1860.58. However, once the price action breaks out above the 38.2 per cent Fibonacci by more than $5, bulls would be able to move their stop-loss orders to 1817.70 in order to protect their positions from the possibility of sudden dropdowns. Alternatively, they could implement floating TPs.
Gold with a New Uptrend, Chance to Buy the Next Dip
As was forecasted by our initial analysis, the price of gold is currently in the process of establishing a new uptrend. There are a number of contributing factors causing this upsurge in buying pressure, the primary one being the escalating tensions alongside Ukraine's border with Russia. This is causing investors to seek refuge in lower-risk securities, amongst which gold is the most popular one.
Another major factor worth consideration is soaring inflation. Last week it was revealed that consumer prices in the U.S. accelerated above market forecasts, thereby exacerbating investors' concerns regarding the stability of global recovery.
Given this week's expectations for a solid rebound in U.S. consumption in January, this trend is likely to be boosted. Hence, the underlying uptrend of gold is likely to continue heading further up north. This is why bulls can attempt to implement trend-continuation strategies on the current setup.
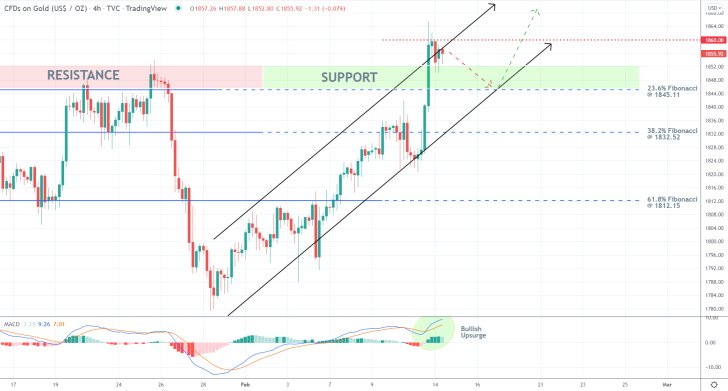
As can be seen on the 4H chart above, the underlying uptrend is represented as an ascending channel. The price action is currently consolidating around its upper limit, which presupposes a probable dropdown towards its lower border.
These expectations for an imminent pullback are further bolstered by the fact that the price action has just broken out above the previous major Resistance Area, thereby turning it into a new Support. The price action is thus due to test the strength of its new role. This is further substantiated by the fact that the MACD indicator is currently signalling peaking bullish momentum.
The resistance-turned-support area is underpinned by the 23.6 per cent Fibonacci retracement level at 1845.11, which is currently coinciding with the lower limit of the channel. That is why the next pullback will probably rebound from this threshold at 1845.11.
That is why bulls can place long limit orders there (at 1845.11) on the expectations for such a rebound. Their supporting stop-loss orders should not be placed lower than $6 from their initial entry level. Once the price action breaks out above the previous swing peak at 1860.00, bulls would be able to substitute their fixed orders for floating TPs.
That way, they would be able to protect themselves against sudden dropdowns while also catching the most out of the anticipated breakout into uncharted territory.
Gold with a Chance for a Reversal from the Last Swing Peak
Bullish bias is rapidly rising on the price action of gold, driving it higher. The price action is currently drawing near the previous swing peak, where a temporary correction could emerge. The upsurge in buying pressure is the result of political uncertainty and mixed economic indication.
The escalating tensions between the West and Russia are contributing to this increasingly more uncertain geopolitical environment, which is causing investors to seek refuge in safe-haven securities. Meanwhile, rapidly growing inflation and shaken economic sentiment underpin the uneven pace of global recovery.
All of these factors are contributing to the emergence of a classic setup for both bulls and bears. The former may attempt to utilise trend-continuation strategies at the dip of the next correction, whereas the latter may apply contrarian strategies in anticipation of such a correction.
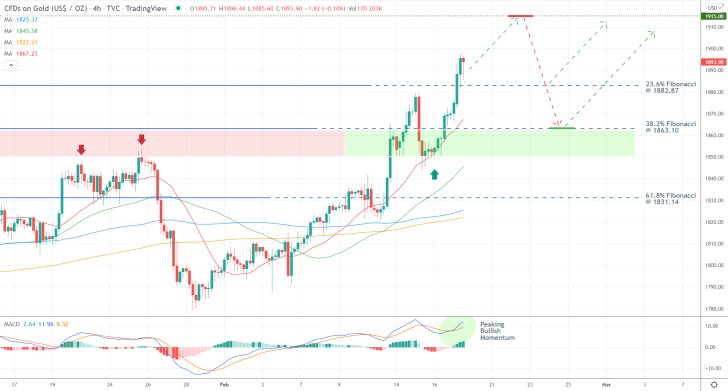
The 4H chart above represents this very solid bullish commitment that prevails in the market at present. As can be seen, the price action has recently broken out above the major resistance-turned-support area (currently in green), which was the first major bullish development of the new uptrend. It is currently headed towards the previous swing peak at 1915.00, which is where the next correction could emerge from.
The recent upsurge in bullish momentum, as underscored by the rising histogram of the MACD indicator, is what signifies the likelihood for a shortcoming test of the 1915.00 resistance level.
The eventual correction is likely to bottom out either at the 23.6 per cent Fibonacci retracement level at 1882.87 or the 38.2 per cent Fibonacci at 1863.10. The former is about to converge with the 20-day MA (in red), whereas the latter is about to be crossed by the 50-day MA (in green). Meanwhile, the crossover between the 100-day MA (in blue) and 200-day MA (in orange) is likely to bolster the strength of the 61.8 per cent Fibonacci at 1831.14.
Bears could place short limit orders at 1915.00, with supporting stop-loss orders placed no higher than $5 above their initial entries. Their target would be the 38.2 per cent Fibonacci at 1863.10, though they should be ready to possibly collect their running profits manually if the price action were to rebound from the 23.6 per cent Fibonacci.
Bulls, in contrast, could place long limit orders either at the 23.6 per cent Fibonacci at 1882.87 or the 38.2 per cent Fibonacci itself. They should apply the same type of risk management. Once the price action reaches the 1915.00 resistance, bulls would be able to apply floating TPs in order to squeeze the maximum out of a breakout into uncharted territory.
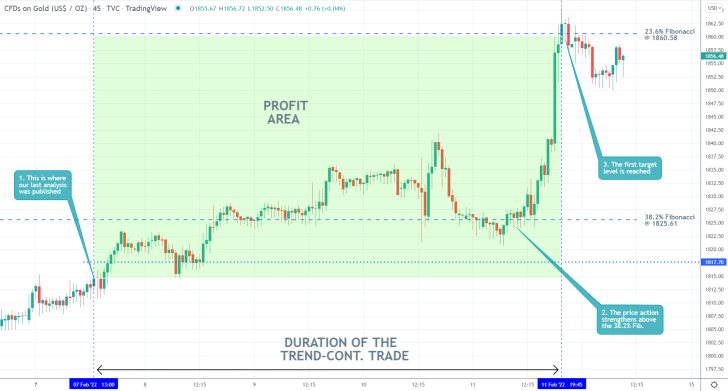
- Our last gold analysis proved a massive success! It forecasted the uninterrupted continuation of the pre-existing uptrend to the 23.6 per cent Fibonacci retracement level at 1860.58.
- The trade caught over $40 from the upswing, amounting to nearly 2.50 per cent profits.
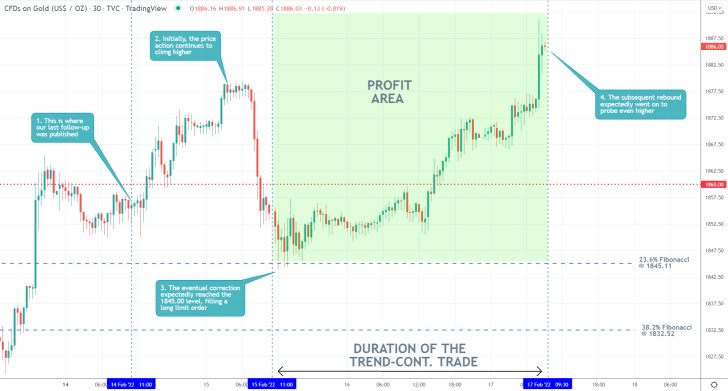
- Our last gold follow-up performed exceedingly well. The price action did fall to the 23.6 per cent Fibonacci retracement level at 1845.11, as expected.
- A long limit order was filled there, catching the subsequent rebound.
- It was the precision of the trade execution that was the most solid aspect of the analysis.
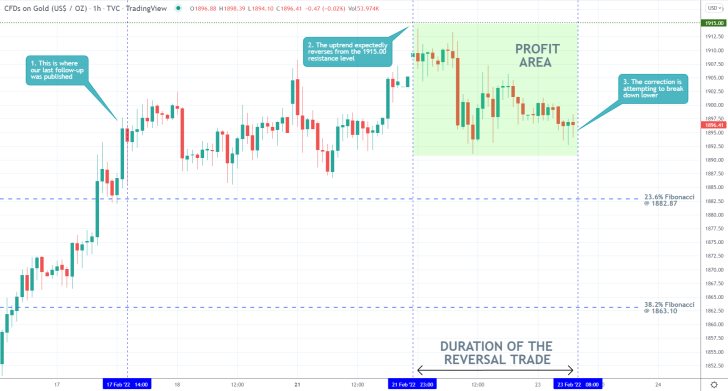
- The expectations of our previous gold analysis for a reversal from the major resistance level at 1915.00 are so far being realised.
- The preceding uptrend was, at least temporarily, stopped there, and the price action is currently heading lower.
- The next major target for the correction remains the 23.6 per cent Fibonacci retracement level at 1882.87.
Disclaimer: Your capital is at risk! Trading and investing on the financial markets carries a significant risk of loss. Each material, shown on this website, is provided for educational purposes only. A perfect, 100% accurate method of analysis does not exist. If you make a decision to trade or invest, based on the information from this website, you will be doing it at your own risk. Under no circumstances is Trendsharks responsible for any capital losses or damages you might suffer, while using the company’s products and services. For more information read our Terms & Conditions and Risk Disclaimer.


