Gold continues to be Wall Street's good old and reliable workhorse, in the sense that it maintains its role as the most sought after safe-haven asset. The next few months look like are going to be quite turbulent and eventful, with the US election looming nearer, and the global pandemic continuing to worsen relentlessly. So, the precious metal would most certainly play a pivotal role for investors in surviving these tough and unpredictable times ahead.
In a sense, little has changed in gold's fundamental outlook since our previous analysis of the asset. The coronavirus crisis and the uncertainty stemming from the Presidential race continue to be the most significant determinants for gold's underlying supply and demand dynamic. The only difference is that the impact of those two has become more pronounced over the last few weeks.
The market has already priced in a likely Joe Biden win, so the aftermath of the elections is unlikely to stir any major market surprises. However, if he does indeed win and then Donald Trump decides to dispute the results of the election in the US Supreme Court, this could prompt new rounds of uncertainty. Consequently, the global demand for gold is likely to be further bolstered.
As regards the coronavirus crisis, yesterday's AstraZeneca vaccine news temporarily relieved the strained global markets, but pressure is bound to keep mounting as the global cases surge. Eventually, Governments are going to be forced to reintroduce stricter containment measures, which, in turn, would support the high demand for gold.
Overall, the underlying fundamentals seem to suggest that the price of the precious commodity is likely to continue appreciating in the following weeks and months; however, as it is about to be seen, the technical picture is less clear-cut.
1. Long-Term Outlook:
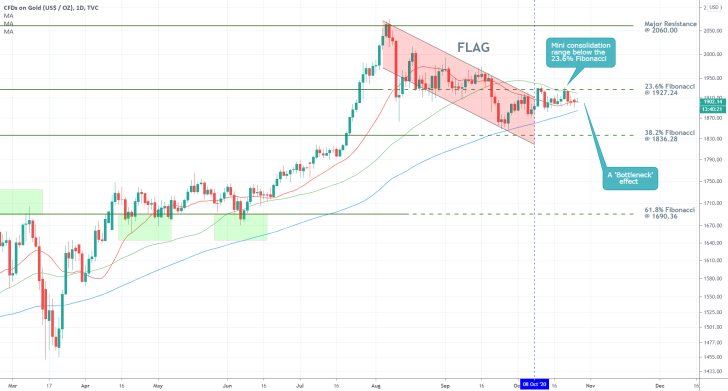
As can be seen on the daily chart below, the price action of gold is currently contained close to the upper boundary of a consolidation range. The latter spans between the 23.6 per cent Fibonacci retracement level at 1927.24 and the 38.2 per cent Fibonacci retracement level at 1836.28. The range emerged on the 8th of October following the termination of the descending flag pattern.
The flag was terminated just above the 100-day MA (in blue), which has served the role of a major floating support since before the advent of the coronavirus crash. This first test of the moving average's strength in late-September represented the first major bearish test since March, which could potentially pan out to be an early prelude to the formation of a more sizable bearish downtrend.
What is particularly interesting is that the price action has been consolidating above the 100-day MA but below the 50-day MA (in green) over the last couple of weeks. Moreover, it is threading just above the 20-day MA (in red). This behaviour is currently creating a clearly visible 'Bottleneck' effect – the containment of the price action between the two bigger MAs.
Such muted price action typically entails diminished trading activity prior to the formation of a substantial breakout in either direction. Essentially, gold can be said to be currently experiencing the 'calm before the storm', as the old trading adage goes. If gold breaks out above the 50-day MA and the 23.6 per cent Fibonacci, then the next target would be the psychologically significant resistance at 2000.00. Conversely, a breakdown below the 100-day MA would clear the way for the bears to test the strength of the 38.2 per cent Fibonacci next.
2. Short-Term Outlook:
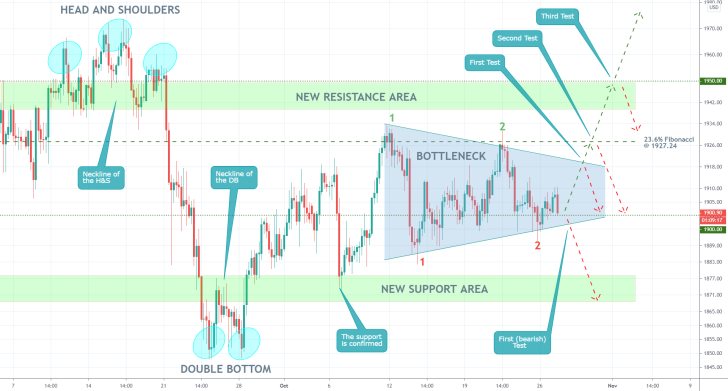
The 4H chart below encapsulates the nature of the bottleneck pattern itself. The price action has already tested twice the upper and lower limits of the bottleneck, which means that it could do so at least one more time before a decisive breakout/breakdown occurs.
Prior to the creation of the bottleneck, the price action established one head and shoulders pattern, and one double bottom pattern. The neckline areas of the two roughly outline two crucial areas, one resistance and one support. Hence, the eventual breakout/down from the bottleneck would also have to deal with the two areas in green.
Given the aforementioned fundamentals, a bullish breakout seems more plausible; however, a potential breakdown should not be completely dismissed either. At present, the price action finds itself trading just above the psychologically significant support at 1900.00, which is a prominent turning point. A potential breakdown below it would entail decisiveness of the market bears and could lead to further downswings south.
In contrast, a breakout above the bottleneck would have to deal with three crucial tests – the upper boundary of the bottleneck itself; the 23.6 per cent Fibonacci; and the 1950.00 resistance.
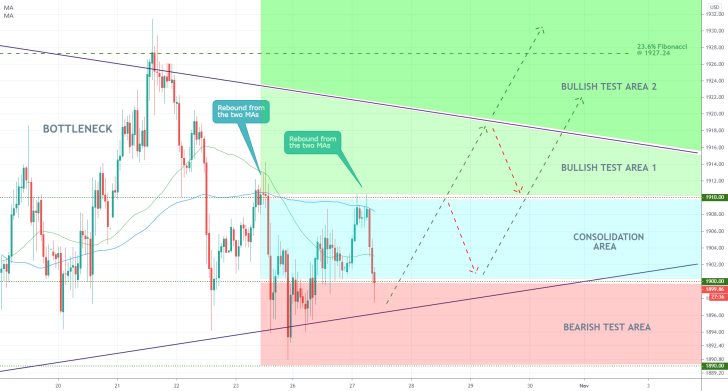
As can be seen on the hourly chart below, the price action has already rebounded from the 100-day MA on two separate occasions, which represents a substantial confirmation of the short-term bearish bias in the market. Nevertheless, the price action is probing but failing to break down below the 1900.00 support, which manifests rising bullish pressure.
3. Concluding Remarks:
The market bears would be looking for an opportunity to use trend-continuation trading strategies (continuing the downswing from where the aforementioned flag left off), provided that the price action manages to break down below the bottleneck, the 1900.00 psychological support, and enters into the 'bearish test area'. Given the mostly bullish-oriented fundamentals and the fact that the price action remains concentrated above the 100-day MA on the daily chart, this approach is seen as entailing a high degree of risk.
The market bulls, in contrast, would be looking for an opportunity to use trend-reversal trading strategies. While the price action remains concentrated within the mostly neutral 'consolidation area', as seen on the hourly chart above, the bulls could suffer from adverse fluctuations. Accordingly, if the price action manages to break out above the 'bullish test areas 1 and 2', there would be more pieces of evidence justifying the longer-term bullish projections.
Can Heightened Volatility Break the Range-Trading Sentiment?
Gold has had a few very tumultuous days that could have long-lasting consequences for its price action. Following up on the last journal entry, the price of the precious commodity quite expectedly continued its rise above the 23.6 per cent Fibonacci retracement level at 1927.24 before the extra volatility from the Presidential Race and the surprising vaccine news caused a massive dropdown.
The reason for the sudden plunge is owing to a swift change in global demand dynamics. Namely, the news of the potentially game-changing COVID-19 vaccine, which could allow for the global economic activity to reach pre-crisis levels if applied on a massive scale, prompted a sudden spike in investors' confidence.
Even though pandemic uncertainty continues to pose a significant threat to global growth, the news was received by the market as a likely indication for the end of the beginning of the crisis, which temporarily disrupted the demand for safe-havens. Once the impact of this general market excitement starts to wane; however, gold is likely to continue advancing higher, unless its price manages to break down below a prominent range.
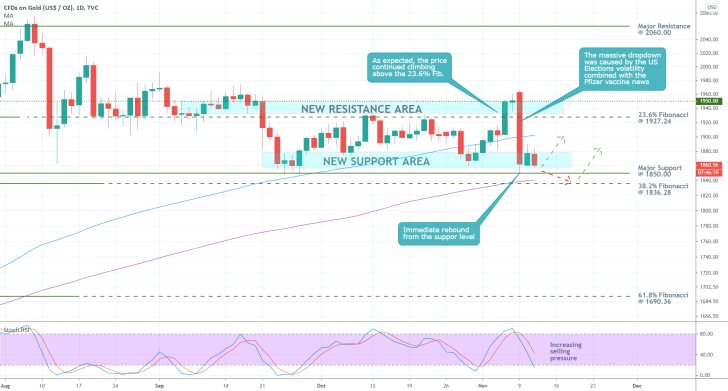
As can be seen on the daily chart above, after the aforementioned tumble, gold's price action is once again consolidating within the boundaries of the New Support Area. In other words, it is trading around the lower edge of the broader range, which extends to the New Resistance Area.
Once the massive volatility levels depreciate, as mentioned above, another bullish rebound can be expected to develop. That is if the underlying range-trading sentiment is preserved, and there is plenty of evidence to support such expectations. Chiefly, even if the price action breaks down below the major support level at 1850.0, the converging 150-day MA (in purple) and the 38.2 per cent Fibonacci retracement level at 1836.28, would still represent two very probable turning points.
Once a new bullish swing towards the upper boundary of the range starts developing, the 100-day MA (in blue), which is currently serving the role of a floating resistance, would represent the first substantial test for the underlying bullish sentiment. Nevertheless, market bulls should not rush to weigh in on this.
As can be inferred from the Stochastic RSI indicator, at present, the market is ostensibly being driven by growing selling pressure, which may yet cause a breakdown below the range's lower border. Hence, bulls who plan to use range-trading strategies – applicable with swing trading in this case – should wait and see how the price behaves next around the lower boundary of the range. If no decisive breakdown emerges next, this will allow them to go long the price of gold, as the commodity resumes trading higher.
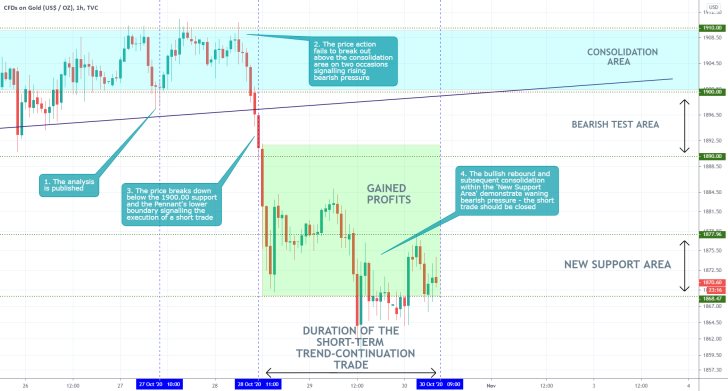
- The analysis anticipated an imminent breakout or breakdown after its publication, and quite accurately described under what circumstances it would be prudent to trade in either case. The price action fluctuated within the boundaries of the 'Consolidation Area', even establishing two failed breakouts, before tumbling down south. This behaviour was said to be demonstrative of the likely formation of a new dropdown. Afterwards, the price action established a decisive breakdown below the psychologically significant support at 1900.00 and the lower boundary of the Pennant, both of which signalled the execution of a short trade.
- As can be seen, the price action developed a sudden bullish pullback within the boundaries of the so-called 'New Support Area', which was established from the neckline of the last Double Bottom pattern. As was argued in the analysis, this area serves the role of a potential turning point, and a consolidation of the price action within its boundaries could be interpreted as an early signal of a new bullish reversal. That is why the short trade should be terminated at the spot price. Traders should not be blinded by the success of their open positions and be mindful of pieces of evidence demonstrating the changing market sentiment.
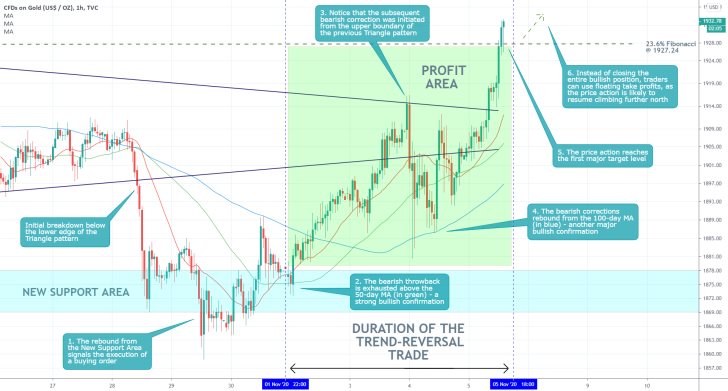
- The rebound of the price action, which was alluded to in the original analysis and subsequently was argued for in the last journal entry, is now completed. As can be seen, the price action climbed to the first target level represented by the 23.6 per cent Fibonacci retracement level at 1927.24, with the possibility of continuing its ascend.
- Several important outtakes can be drawn from the above scenario. First, the need for traders to remain patient and collected has been confirmed yet again. As can be seen, before fulfilling the longer-term bullish projections, the price action tumbled to the 'New Support Area', which was expected. Moreover, the subsequent uptrend was not as clear-cut as most bulls would have liked it to be – there were a couple of dropdowns to the 100-day MA, driven by the uncertainty from the Presidential elections.
- Finally, the market remains ostensibly bullish, so the reaching of the first major target level should not necessarily be interpreted as a take profit signal. Instead, bulls could use floating take profits to catch any further gains up north, while at the same time capping the underlying risk just below the 23.6 per cent Fibonacci.
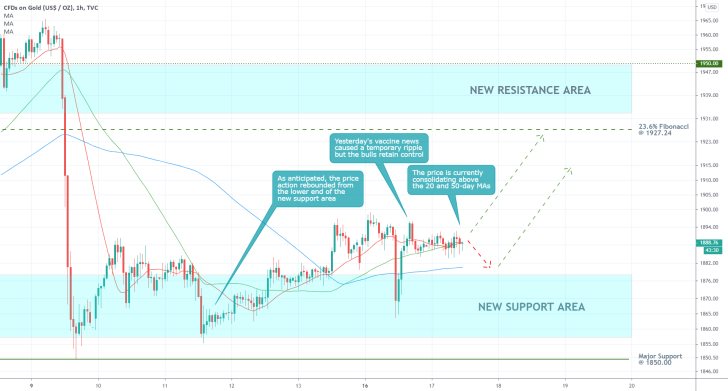
- As expected, gold's price action started appreciating after having reached the lower end of the New Support Area. A momentary disruption was caused yesterday after the publication of the Moderna Inc. vaccine news, but the quick rebound after the initial shock underpins the strong control of the market bulls. Hence, the price action is expected to continue appreciating towards the 23.6 per cent Fibonacci, as per the projections of the last follow-up, but it can do so in one of two ways.
- The price action can either start appreciating immediately after it stops consolidating above the 20-day MA (in red) and the 50-day MA (in green); or it could retrace back to the 100-day MA (in blue), which is currently converging towards the upper boundary of the New Support Area, before the bullish momentum is resumed.
- At any rate, the current market sentiment entails perfect conditions for the use of trend-continuation trading strategies. Traders can use the behaviour of the price action around the three MAs as potential entries.
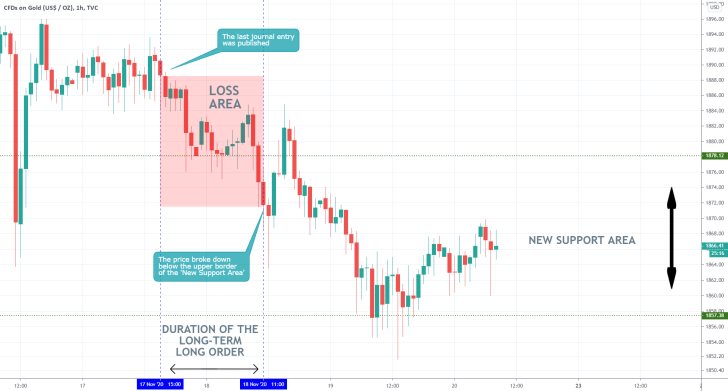
- The projections of the last journal entry were not realised, as the price of gold tanked towards the lower boundary of the 'New Support Area'. On the one hand, the journal entry did not take into account the impact of the recent vaccine news on the global demand for safe-havens. Gold typically does not appreciate at times of general investors' optimism.
- On the other hand, the journal entry falsely assumed the consolidation of the price action just above the 'New Support Area' as an opportunity for trend-continuation trading. Traders should be able to distinguish between interim range-trading following a recent directional swing and minor consolidation within a developing trend.
Disclaimer: Your capital is at risk! Trading and investing on the financial markets carries a significant risk of loss. Each material, shown on this website, is provided for educational purposes only. A perfect, 100% accurate method of analysis does not exist. If you make a decision to trade or invest, based on the information from this website, you will be doing it at your own risk. Under no circumstances is Trendsharks responsible for any capital losses or damages you might suffer, while using the company’s products and services. For more information read our Terms & Conditions and Risk Disclaimer.


