Gold's price action has been consolidating in a broad range for over half a year now, which is a confirmation of the very strong range-trading conditions that prevail at present. Under those conditions, bulls and bears may implement the highly effective strategy of picking the underlying range's tops and bottoms. And given that the price action is currently drawing near one of the range's extremes, bears may have a chance to do just that very soon.
The commodity has been on the advance recently following the parallel dollar depreciation. The latter was caused by the soaring inflation in the U.S. However, this trend may soon be reversed given the expectations for another robust earnings season in the country.
Morgan Stanley became the first major financial institution to report better-than-expected earnings data for the fourth quarter, which is likely to offset at least partly the U.S. stock market's current woes. In turn, the greenback would probably benefit from a temporary improvement in investors' sentiment, prompting a parallel upsurge in selling pressure on gold.
This confluence of bearish indications underpins the opportunity for bears to sell the price of gold as it probes the upper limit of the massive consolidation range on the expectations for another reversal.
Establishing the Borders of the Consolidation Range
As can be seen on the daily chart below, the consolidation range spans between the 61.8 per cent Fibonacci retracement level at 1769.41, which is found below the psychologically significant threshold at 1800.00, and the 23.6 per cent Fibonacci at 1861.22.
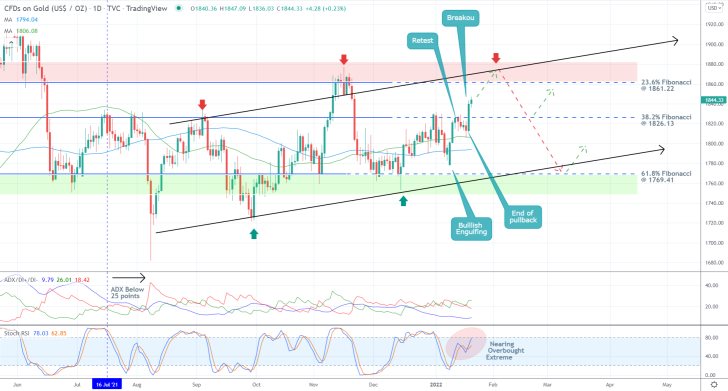
The prominence of the range-trading conditions is bolstered by the fact that the ADX indicator has been threading below the 25-point mark since the 16th of July. Shortly afterwards, an ascending channel with not a very steep angle started developing within the boundaries of the range.
Hence, a reversal from the upper limit of the channel and the 23.6 per cent Fibonacci seems even more plausible. This is further substantiated by the fact that the Stochastic RSI indicator is nearing its overbought extreme, which is likely to cause an upsurge in selling pressure over the following days.
Despite all of these ostensibly bearish signals, bears should be careful not to enter short prematurely. Pay attention to the breakout above the 38.2 per cent Fibonacci at 1826.13, which is positioned roughly in the mid-point of the range.
An initial fakedown below the 100-day MA (in blue) was promptly followed by a Bullish Engulfing candle. The subsequent retest of the Fibonacci threshold then led to another throwback, this time to the 50-day MA (in green). Finally, the price action broke out above 1826.13 in another massive Bullish Engulfing candle.
That is why even short orders opened at the 23.6 per cent Fibonacci would entail a sizable risk of incurring losses from potential adverse fluctuations, which would apply to a greater degree to short orders executed around the current spot price.
Mounting Bearish Signals in the Short Term
A smaller still regression channel is drawn on the 4H chart below. It indicates that despite the above-stated disclaimer, a minor correction to the 38.2 per cent Fibonacci emerging in the immediate future is not entirely inconceivable.
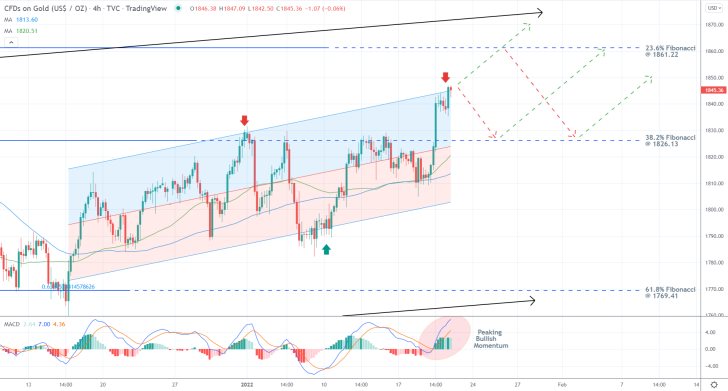
This is bolstered by the fact that the price action is currently probing the upper limit of this smaller regression channel while the underlying bullish momentum appears to be peaking. The histogram of the indicator has already started to decline over the last several hours, while the currently emerging wave would most probably fail to exceed the previous one.
And while the price action looks poised to jump up and down between the 23.6 per cent Fibonacci and 38.2 per cent Fibonacci in the near term, it is worthwhile examining the behaviour of the price action in the very short term to determine where would be the best place to join the market.
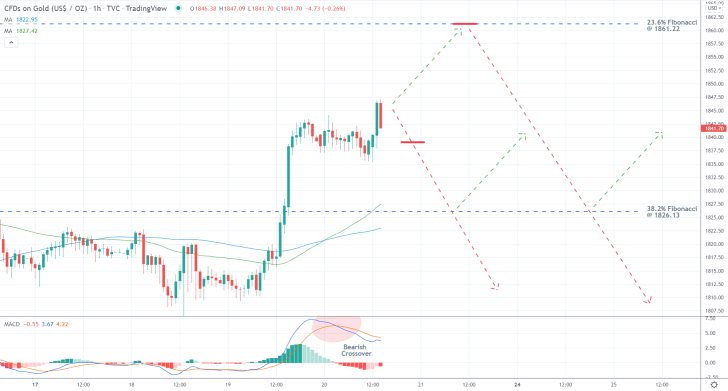
As can be seen on the hourly chart below, the price action is currently concentrated at the mid-point between the two Fibonacci thresholds. Hence, entry into the market would boil down to the risk management preferences of each individual trader.
What can be said with certainty is that both the 50-day MA and 100-day MA are currently converging with the 38.2 per cent Fibonacci, making it an even more prominent turning point.
Meanwhile, the MACD indicator has already picked up a strong upsurge in bearish momentum in the very short term. This is demonstrated by the rising bearish histogram and the fact that the 12-day EMA has crossed below the 26-day EMA 9in orange)
Concluding Remarks
Less risk-averse bears might try to sell around 1840.00, though they should implement very narrow stop-losses, not more than $9 above their initial entry levels. Their first target would be the 1826.12 level, which is where the minor correction is most likely to be terminated. However, they would be able to substitute their fixed stop orders for floating TPs once the price action draws near to it, in case the correction manages to break lower.
More risk-averse bears, in turn, could place short limit orders at the 23.6 per cent Fibonacci at 1861.22, implementing stop-losses that are also positioned not more than $9 above the initial entry. Their near-term target would be the same 38.2 per cent Fibonacci, where they, too, can incorporate floating TPs. The longer-term target, however, remains the lower end of the consolidation range at the 61.8 per cent Fibonacci.
Textbook Setup on Gold Ahead of the FED Meeting
The price action of Gold has been advancing exactly as per the expectations of the Elliott Wave theory, which implies the possibility for the utilisation of trend-continuation trading strategies. Namely, bulls and bears can try to pick the tops and bottoms of the Elliott cycle as the uptrend continues to probe higher in the coming weeks.
Gold has been advancing alongside the U.S. dollar amidst a general pick-up in investors' demand for lower-risk securities. This is caused by the escalating tensions between Russia and Ukraine, which investors fear might lead to war. As a consequence, demand for higher-risk assets is diverted towards safe havens with much lower risk.
That is why the price action of the commodity is likely to keep rising in the medium term, thereby completing the Elliott cycle. However, an interim bearish correction might emerge first. The catalyst for such a dropdown may very well pan out to be the highly-anticipated Fed meeting for January.
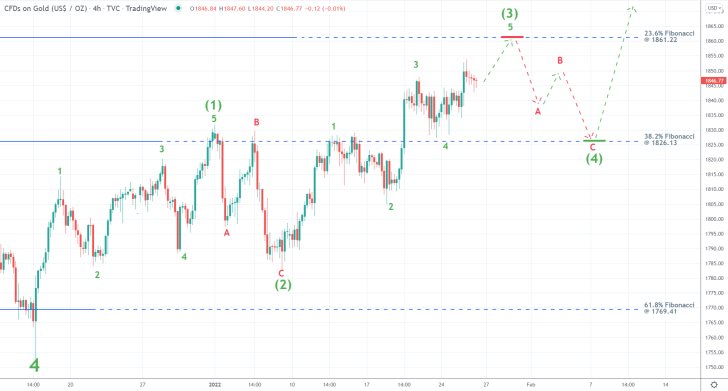
The broader uptrend, which was first demonstrated in our latest comprehensive analysis of the commodity, is taking the form of a massive 1-5 impulse wave pattern. As can be seen on the 4H chart above, the price action is currently in the process of developing the final impulse leg (4-5).
Due to the fractal nature of the price action, it itself takes the form of a 1-5 impulse wave pattern. Its initial impulse leg corresponds to the upswing to the 38.2 per cent Fibonacci retracement level at 1826.13; the first retracement leg (1-2) from said Fibonacci threshold took the form of an ABC correction; and now, the price action is busy developing the second impulse leg (2-3).
Further still, this second impulse leg is also structured as a 1-5 impulse wave pattern, underlining the scalability of the price action. There seems to be a confluence of bearish indications, all pointing to a likely reversal from the 23.6 per cent Fibonacci retracement level at 1861.22, in what is likely to be the second retracement leg (3-4); very likely taking the form of an ABC correction.
That is why bears may take advantage of this setup by placing short limit orders around 1860.00, with supporting stop-loss orders that do not exceed $15 from their initial entries. They can then collect their profits at the 38.2 per cent Fibonacci at 1826.13. Bulls, in contrast, could place long limit orders there on the expectations for the final impulse leg (4-5) starting from this threshold.
Gold's Correction is Now Over. It is Time for a New Upswing
The price of gold tumbled more than $60 in the wake of FED's January policy decision when it was decided that the bank would actively pursue a rate hike in the near future. However, the bearish correction was curtailed at the last major support area, which implies that it is now time for another bullish upswing.
The demand for safe-haven assets continues to be strong owing to the protracted uncertainty of war between Russia and Ukraine, and the bumpy and uneven pace of global economic recovery. It is precisely this investors' weariness that is likely to drive the price action of gold higher in the near future.
The underlying set-up is thus suitable for the implementation of trend-continuation trading strategies by bulls looking to buy the dip of the recent correction. Meanwhile, bears could possibly have a chance to trade the likely adverse fluctuations that usually accommodate such trend reversals, though this would entail using the much riskier contrarian trading strategies.
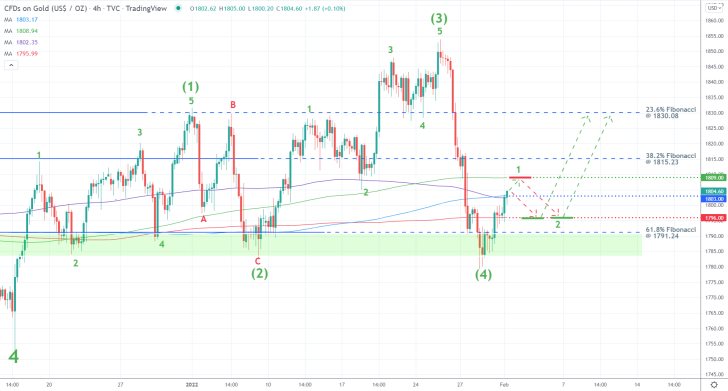
As can be seen on the 4H chart above, the price action continues to be developing a massive 1-5 impulse wave pattern, as postulated by the Elliott Wave theory. This is exemplified by the fractal nature of the price action (check the link to the article for more information about fractality and scalability associated with the EWT).
The second retracement leg (3-4) thus appears to have been completed above the 61.8 per cent Fibonacci retracement level at 1791.24, outlining the upper limit of a massive support area (in green). This underscores the probable development of the third and final impulse leg (4-5) next.
The price action is currently contained near the psychologically significant 1800.00 threshold and within the 600-day MA (in red) and 400-day MA (in green). The former underpins the major support at 1796.00, whereas the latter demonstrates the major resistance at 1809.00. The crossover between the 300-day MA (in purple) and 500-day MA (in blue), in turn, signifies the major support at 1803.00.
Bears could possibly place short limit orders at 1809.00, anticipating a reversal to 1796.00. In order to keep the 3:1 golden ratio, their supporting stop-loss orders should not exceed $4 above their initial entries.
Bulls could, in turn, place long limit orders at the 1796.00 support. Their ultimate target would be the 23.6 per cent Fibonacci at 1830.08, though once the price action breaks out above the 1809.00 resistance, they would be able to move their stop-loss orders to breakeven. Initially, however, bulls' SLs should be placed just below the 61.8 per cent Fibonacci at 1791.24.
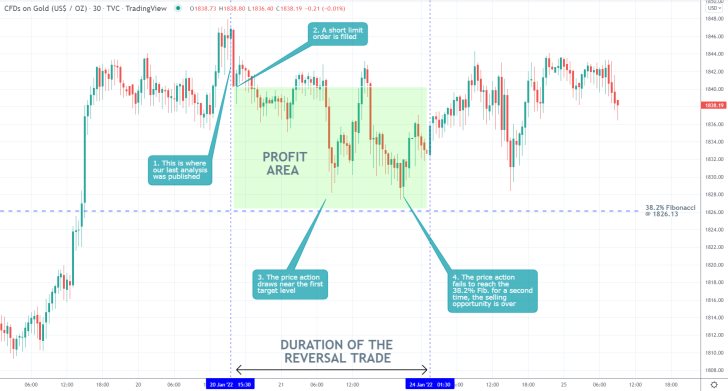
- Following the release of our last gold analysis, the price action started falling, as anticipated. However, the dropdown did not reach the first target level at the 23.6 per cent Fibonacci retracement level at 1826.13.
- It failed to do so on three separate occasions and instead consolidated in a range around the 1840.00 level.
- This is a good example of the benefit of using floating TPs - that way, traders can protect their running profits while also hedging themselves against the possibility of sudden changes in the direction of the price action.
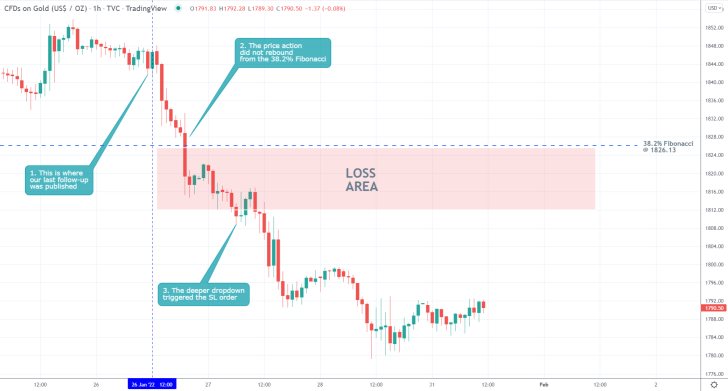
- The expectations of our last gold analysis were not realised. The price action did not rebound from the 38.2 per cent Fibonacci retracement level at 1826.13.
- Even though the implementation of trend-continuation strategies is generally considered to be less risky, they are still exposed to the risk of unexpected trend reversals.
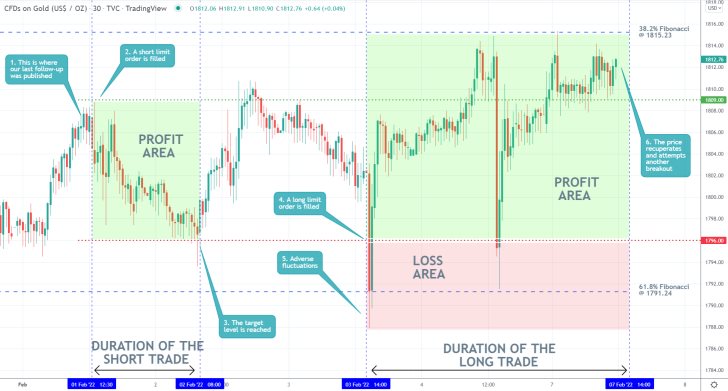
- The expectations of our last follow-up on gold were almost fully realised. Initially, the price action reversed from the resistance at 1809.00 and fell to the support at 1796.00.
- Despite some adverse fluctuations afterwards, the price action did rebound from the latter and went up north.
- Even though it is still hasn't reached the ultimate target at the 23.6 per cent Fibonacci retracement level, bullish momentum is gradually mounting as the price action once again prepares for a test of the 38.2 per cent Fibonacci at 1815.23.
Disclaimer: Your capital is at risk! Trading and investing on the financial markets carries a significant risk of loss. Each material, shown on this website, is provided for educational purposes only. A perfect, 100% accurate method of analysis does not exist. If you make a decision to trade or invest, based on the information from this website, you will be doing it at your own risk. Under no circumstances is Trendsharks responsible for any capital losses or damages you might suffer, while using the company’s products and services. For more information read our Terms & Conditions and Risk Disclaimer.


