Gilead Sciences Inc. is an American biotech company listed on the S&P 500, with a market capitalisation of almost 94 billion dollars. The company is also one of the frontrunners in the race to develop medical treatment for COVID-19, which is the disease caused by the novel coronavirus SARS-Cov-2.
We have already analysed the company’s stock once in Late-February when it was announced that one of its developmental drugs Remdesivir (originally intended to treat Ebola) would undergo clinical trials on patients suffering from COVID-19. Back then, it was hoped that the drug could eventually be used as a weapon in the fight against the deadly pathogen, and now these initial tests are starting to show promising results.
Gilead Sciences released the findings from the very first tests on the 10th of April, which prompted heightened volatility on its stock price. In addition, the biotech giant announced a rough schedule for future releases of similar data from more comprehensive tests, which would demonstrate how Remdesivir is performing under the various clinical trials. Consequently, the share price of Gilead is expected to continue fluctuating as the medical data from the tests is periodically published.
That is why the purpose of today’s analysis is to examine the likely consequences for Gilead’s share price from these tests that are expected to unfold within the next few months, and also to characterise the behaviour of the price action that has been observed recently.
1. Long Term Outlook:
As can be seen from the weekly chart below, the share price has started to advance into a new Markup since these early clinical trials were commenced in February. The latest bullish trend is broad and characterised by erratic price action, which is caused by the massive underlying volatility.
The volatility itself is prompted by the rapid developments concerning Remdesivir’s medical testing, such as news regarding the scope, timing, and progression of the clinical testing. On the chart, this effect is clearly discernible between the 27th of January and now. That is why the underlying bullish trend is likely to continue advancing with these characteristically volatile price fluctuations.
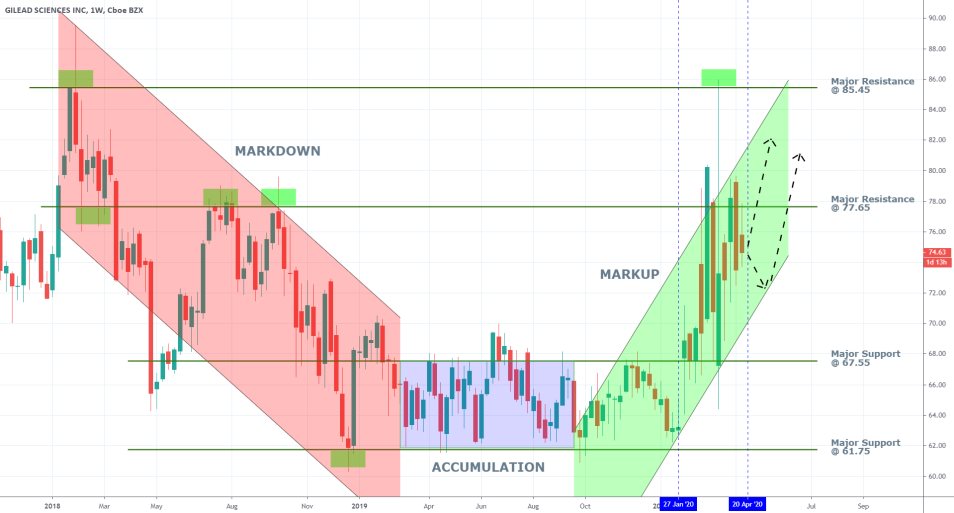
When analysing the stock's broad behaviour on a chart with such a huge timescale, it becomes clear that the price action is transitioning between three distinct stages of the Wyckoff cycle – from MARKDOWN through ACCUMULATION to MARKUP. Based on that, assertions can be drawn regarding the most likely future behaviour of the current bullish trend. After it reaches a peak (presumably after the middle of May at the earliest), it is most likely going to be followed by a new DISTRIBUTION range.
There are two significant obstacles that the currently developing bullish trend would have to eventually overcome, as they present significant tests for the underlying bullish commitment in the market and potential turning points for the direction of the trend. Those are the major resistance level at 77.65 and subsequently, the major resistance level at 85.45. The significance of these has already been confirmed on several occasions during the last bullish swings to test them.
2. The Impact of Clinical Testing on Gilead’s Share Price:
As regards the fundamental aspect of the market, intuitively the external pressures that are being exerted on the stock are going to be derived from the way the aforementioned clinical trials go on. In other words, the adverse fluctuations in the price action are likely to be triggered by the news that is expected to be released in the next several months as more information becomes available.
The following infographic, which was published on Gilead Sciences Inc.’s website, categorises the types, scopes, and rough deadlines for releasing the final results, of the clinical trials that are currently undergoing. The first one that was already released on the 10th of April refers to the aforementioned ‘initial tests’.
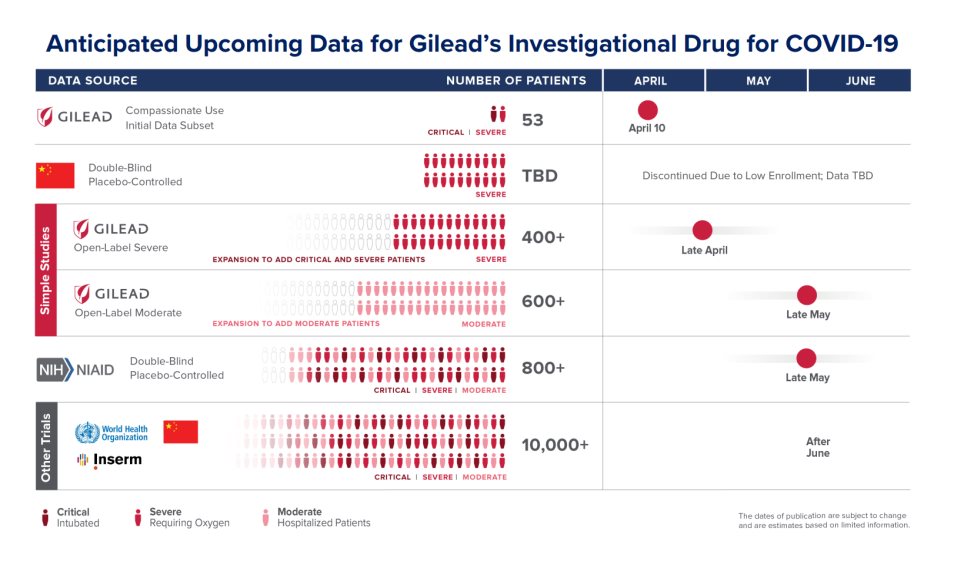
The next tests are not only going to be targeting more people as a whole, but they are also going to test Remdesivir’s effectiveness on patients with different underlying conditions separated into three categories – clinical, severe, and moderate. Additionally, the nature of these tests is also going to differ, differentiating between Placebo-Controlled tests and Double-Blind tests.
All of these tests are thereby expected to provide increasingly more reliable and comprehensive data from Late May onwards. Consequently, the underlying volatility affecting Gilead's share price is likely to surge even more in little over a month and to continue affecting the stock's trading.
In an open letter from Daniel O’Day, Chairman and CEO of Gilead Sciences Inc., from the 10th of April, it is stated that:
“We expect that we will have preliminary data from the study of remdesivir in severe patients at the end of April and will work quickly to interpret and share the findings. The publication of data from the China remdesivir trials rests with the Chinese investigators, but we have been informed that the study in patients with severe symptoms was stopped due to stalled enrollment. We look forward to reviewing the published data when available. In May, we anticipate the initial data from the placebo-controlled NIAID trial as well as data from the Gilead study of patients with moderate symptoms of COVID-19.”
In short, these are the rough guidelines which traders can use to project potential surges in the underlying volatility, which are anticipated to happen in the near future.
As regards the value of Gilead’s stock, it can be expected that the company’s intrinsic value is going to rise within the next several months regardless of remdesivir’s efficiency in treating COVID-19. This is so because the biotech leader is helping advance our cumulative knowledge of the novel pathogen through the clinical trials, so the company is thereby adding value to its self as an indirect consequence.
In other words, the extra (social) value added to Gilead’s stock is derived from the company’s involvement with the undergoing Research and Development connected to COVID-10 and SARS-Cov-2. There are myriad of ways in which a company like Gilead Sciences can benefit indirectly from such positive CSR (Corporate Social Responsibility) reputation. A primary example is its increased popularity, which attracts investors’ attention, subsequently supporting the stock’s underlying bullish sentiment.
3. Short Term Outlook:
The enormous adverse volatility obscures the Markup’s structure to a degree, but the bullish trend continues to exhibit typical behaviour nonetheless. On the daily chart below, there is a false breakout, a throwback, a shooting star just above the channel’s upper edge, and a tight consolidation below a major resistance level – all of these characteristic behaviours are to be expected in a Markup, all of which confirms the previous assertion that the broader bullish trend is still far from being completed.
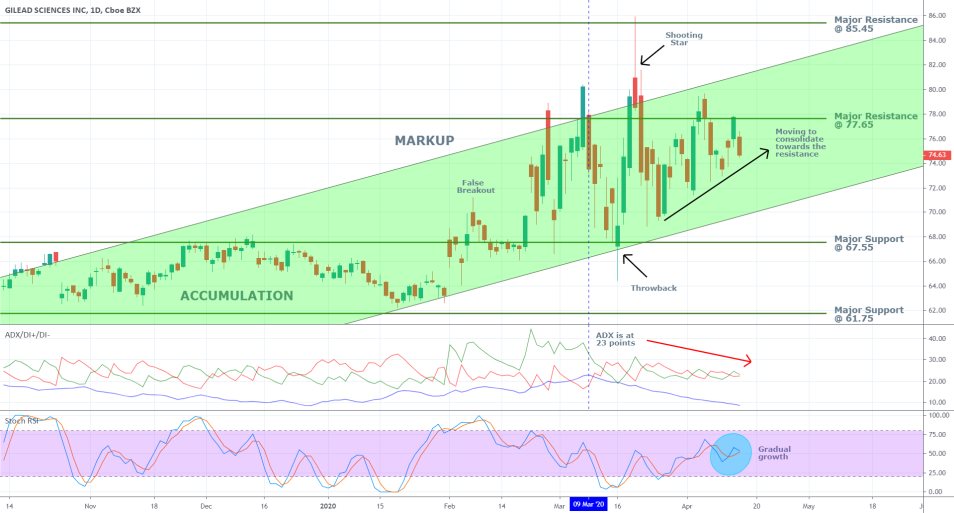
A peculiar development is the apparently falling ADX, which has been depreciating since the 9th of March when the indicator was at 23 points. That is owing to the fact that since then, the median price value has remained the same – 75.50. That is also why DI+ and DI- appear to be threading parallel to each other on the same plane. As a whole, the ADX on the daily chart above demonstrates the existence of an intermediate consolidation range just below the major resistance level at 77.65. Once again, this behaviour is attributed to the existence of the underlying adverse volatility; however, it also manifests the market’s preparation for a subsequent break out above the resistance level.
The Stochastic RSI underpins this sentiment as there is still more room for the underlying buying pressure to increase before the stock becomes ‘Overbought’.
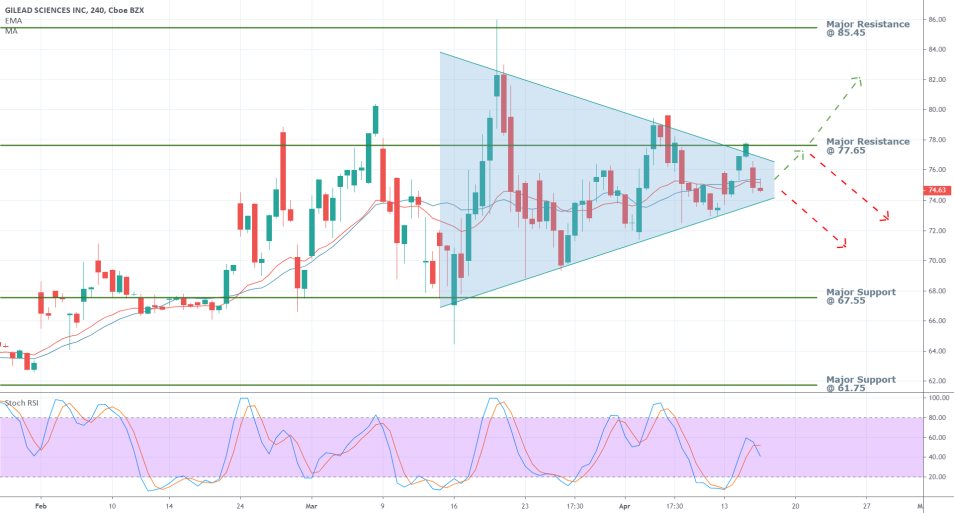
The triangle formation confirms the expectation for an eventual breakout above the major resistance level at 77.65 on the 4H chart below. Such commonly found patterns illustrate the consolidation of the price action above/below a major price level before a breakdown/breakout occurs.
It should, however, be cautioned against potential reversals in the direction of the underlying price action. In case that Gilead's share price rebounds from the resistance, it could fall as low as 64.55 before it finds support there. The likelihood of such a scenario unfolding is confirmed by the behaviour of the Stochastic RSI on the 4H chart, and more specifically by its recent crossover. It indicates the currently changing buying/selling pressure dynamics in the short term, which are presently tilted to the downside.
4. Concluding Remarks:
The conclusion from the fundamental analysis above reveals that the aforementioned bullish trend (Markup on the weekly chart) is likely to persist as the company continues to increase its CSR from its involvement with the R&D into COVID-19. Meanwhile, the concomitant volatility affecting the company’s share price is also likely to increase, as more and more results from the remdesivir trials are released over the next several months.
As regards the technical outlook, the stock price appears ready to test a crucial resistance level in order to continue developing the underlying bullish trend, but reversals are also possible.
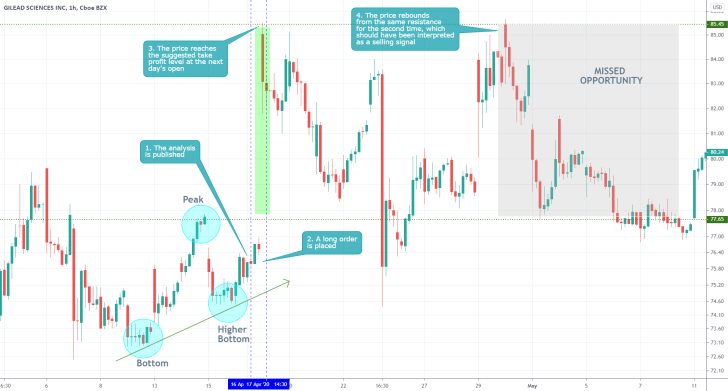
- One of the most important achievements of the analysis was to underpin the high levels of volatility that were affecting Gilead's share price at that time. However, it could have done more in stressing on the high degree of risk that was associated with trading on that particular setup. The trade yielded almost instant gratification in that the suggested take profit level was reached the very next day. However, such a trade would have been suitable only for the least risk-averse traders. In a highly volatile market, it is really difficult to measure the risk/reward ratio, which is why refraining from trading may be the most rational decision.
Disclaimer: Your capital is at risk! Trading and investing on the financial markets carries a significant risk of loss. Each material, shown on this website, is provided for educational purposes only. A perfect, 100% accurate method of analysis does not exist. If you make a decision to trade or invest, based on the information from this website, you will be doing it at your own risk. Under no circumstances is Trendsharks responsible for any capital losses or damages you might suffer, while using the company’s products and services. For more information read our Terms & Conditions and Risk Disclaimer.


