The recent pullback of the GBPUSD appears to have reached a fresh peak ahead of the highly anticipated speech of FED Chair Jerome Powell at the Jackson Hole Symposium, which is scheduled for tomorrow. He is expected to talk about the possibility of FED tapering by early 2021, which is likely to bolster the dollar.
Meanwhile, the pound continues to be pressured as the pace of recovery of the British economy has been waning over the recent period.
Given these starkly opposed outlooks on the two currencies, the GBPUSD looks poised to establish another bearish reversal soon. This means that bears can look for an opportunity to exercise trend continuation trading strategies at the peak of the pullback.
In other words, they would be joining the market on the expectations for the continuation of the broader downtrend past the previous swing low.
Is the Pullback Really Over?
As can be seen on the daily chart below, the significance of the broader downtrend is underpinned by the descending trend line (in red). For the time being, the price action is consolidating around the 23.6 per cent Fibonacci retracement level at 1.37333. However, if the pullback penetrates above it, the price action is likely to head towards the descending trend line before a decisive reversal occurs.
The pullback itself was commenced from the psychologically significant support level at 1.36000 (swing low), which means that after the development of the downtrend is resumed, this would be the first target level for the renewed price depreciation.
Whether bears get a chance to sell right away around the current spot price or bulls would be able to ride the pullback towards the descending trend line would depend greatly on the behaviour of the price action around the 23.6 per cent Fibonacci retracement level.
Even if the latter turns out to be the case and the price action goes on to consolidate above the 23.6 per cent Fibonacci for a little bit longer, bulls should not overestimate the bullish commitment in the market.
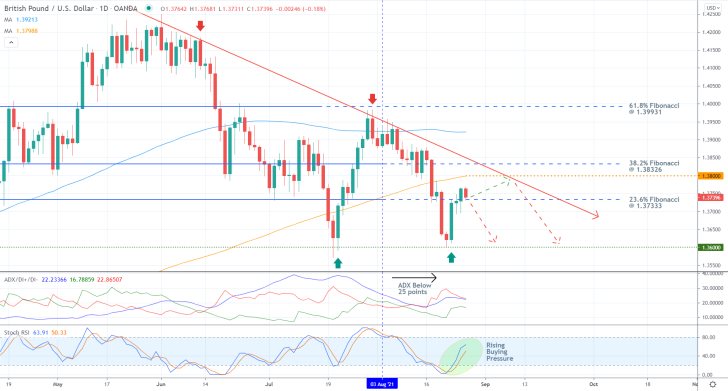
Notice that the 200-day MA (in orange) has turned from a floating support into a floating resistance, which underscores the solid bearish outlook in the longer term. Moreover, the moving average has just reached the psychologically significant resistance level at 1.38000, which is being crossed by the descending trend line.
The 1.38000 threshold, thus, looks like the highest potential turning point that the pullback could reach before a decisive reversal takes place.
However, bears should be cautious as well. The ADX indicator has been threading below the 25-point mark since the 3rd of August, which means that the market is technically range-trading at present. This development is more favourable to bulls in the short term, as it raises the likelihood of pullbacks being established within the downtrend.
Additionally, the Stochastic RSI indicator is currently demonstrating rising buying pressure, which could help the underlying pullback reach the descending trend line over the next several days.
Even More Intricate Fibonacci Examinations
The pullback itself appears to be taking the form of a classic Cup and Handle pattern, as demonstrated on the 4H chart below. This is a type of structure that typically entails probable bullish rebounds, which is congruent with the expectations for the continuation of the pullback towards the psychological resistance at 1.38000.
However, in addition to the consolidation of the price action around the 23.6 per cent Fibonacci retracement level, the price action is also probing (from below) the minor 0.382 Fibonacci (as measured against the latest downswing) at 1.37476.
Failure to break out above the latter decisively would increase the chances for an immediate reversal of the price action over the next several hours.
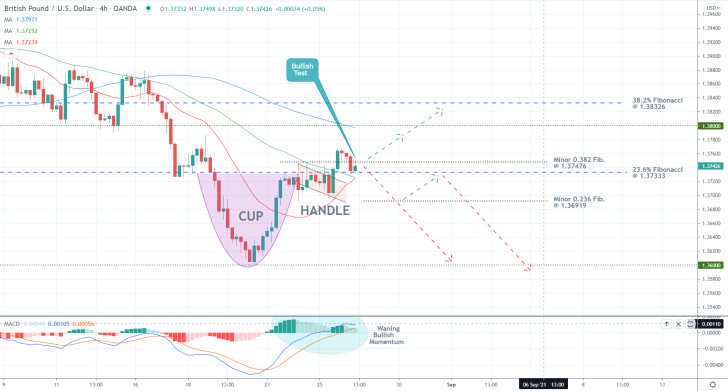
On the one hand, the price action appears incapable of breaking out above 0.382 Fibonacci for the time being. Simultaneously, the underlying bullish momentum is depreciating, as demonstrated by the waning histogram of the MACD indicator. Both of these factors indicate a probable bearish reversal right away.
On the other hand, the price action remains concentrated above the 20-day MA (in red) and the 50-day MA (in green). Unless it manages to close down below the 23.6 per cent Fibonacci retracement level in the near future, the pullback would then very likely be extended towards the 1.38000 resistance. Notice that the latter is presently converging with the 100-day MA (in blue).
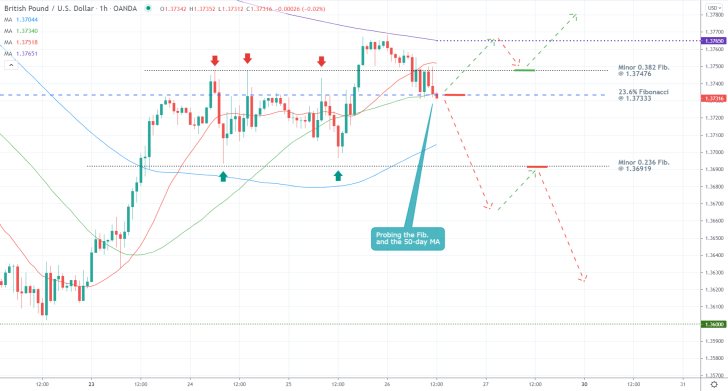
The hourly chart below demonstrates the recent consolidation of the price action within a narrow range in greater detail. Notice that the reversal may have already begun developing since the price action failed to break out above the 300-day MA (in purple)
Depending on their level of risk aversion, bulls and bears could both try to trade on this setup.
Concluding Remarks:
As regards the current opportunities for bulls, they should consider joining the market only on the condition that the price action remains concentrated above the 23.6 per cent Fibonacci over the next several hours.
They could look for another failed test of the 300-day MA (and a subsequent throwback to the 0.382 Fib) as a potential entry. Bulls should keep in mind that the underlying sentiment is ostensibly bearish-looking, which means that such an approach would entail a high degree of risk.
Bears, in contrast, can sell around the current spot price. Their stop-loss orders should not be placed above the 300-day MA at 1.37650. As stated earlier, their first target level is the last swing low (at 1.36000).
GBPUSD Nearing the Completion of an Ascending Wedge
The price action of the GBPUSD has been establishing a sizable bullish pullback ever since the release of our last analysis of the pair. Even so, the broader market sentiment remains mostly tilted to the downside, which implies a probable bearish reversal currently in the making.
The dollar was jolted yesterday on weaker-than-expected ADP employment numbers for August. However, due to the proclivity of the ADP to diverge from the NFP, which is always posted two days later, the market is not yet done pricing in the latest U.S. labour market numbers.
In fact, the consensus forecasts anticipate another robust non-farm payrolls report to be released tomorrow, which would likely help the struggling greenback recuperate in the short term.
The underlying fundamentals thus seem to corroborate the expectations for an upcoming reversal on the price action of the GBPUSD. Consequently, bears can take advantage of this setup by utilising contrarian trading strategies.
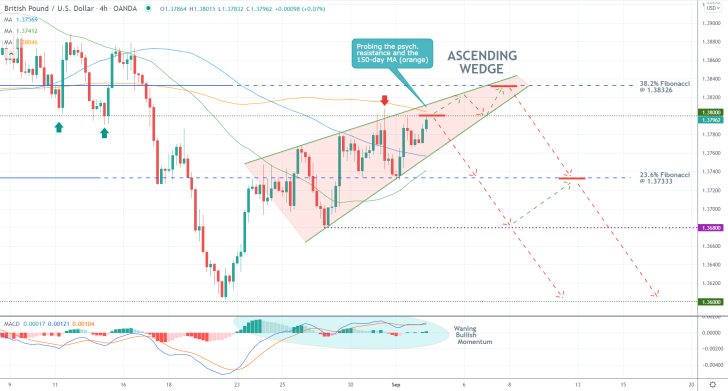
These expectations are also inlined with the behaviour of the price action on the 4H chart above. As can be seen, it is currently establishing an Ascending Wedge pattern, which is typically taken to signify probable reversals.
Not only that, but the Wedge looks poised to be completed between the psychologically significant resistance level at 1.38000 and the 38.2 per cent Fibonacci retracement level at 1.38326 - both prominent turning points.
The mounting bearish bias in the market is further underpinned by the MACD indicator, whose histogram has been waning over the last several days. This is demonstrative of decreasing bullish momentum.
Moreover, the 150-day MA (in orange), which currently serves as a floating resistance, converges with the psychological resistance, making the latter an even more robust threshold. This raises the likelihood of an immediate reversal from the current spot price. However, the possibility of adverse fluctuations towards the 38.2 per cent Fibonacci should not be dismissed entirely.
Bears can look for an opportunity to sell around the current spot price, placing their stop-loss orders 40 pips above their initial entry. This should protect them against such adverse fluctuations to the 38.2 per cent Fibonacci. Even if their SLs get triggered, bears could still sell around 1.38326, provided that there are definite signs of a reversal at that level.
The first major target is encapsulated by the 23.6 per cent Fibonacci at 1.37333, which is currently converging with the 50-day MA (in green). The second is underpinned by the minor support at 1.36800, and the third can be found at the psychological support at 1.36000. The latter serves as the latest swing low.
GBPUSD's New 1-5 Elliott Downtrend
Over the last several days, the price action of the GBPUSD pair has been establishing a new bearish correction, which looks poised to morph into a full downtrend. This is happening as the underlying market sentiment is becoming more ostensibly bearish.
The strengthening of the pound over the last few weeks was owing to a solid pick-up in global economic activity, as investors' fears over the pandemic continue to subside gradually. Nevertheless, the rampant spread of the Delta variant, particularly in developed economies, is now threatening to bring about new disruptions to the pace of global recovery.
All of this is likely to reinvigorate demand for lower-risk assets and more easily convertible currencies, thereby strengthening the greenback. With all of this in mind, traders can now consider entering short on the GBPUSD in anticipation of a new downtrend.
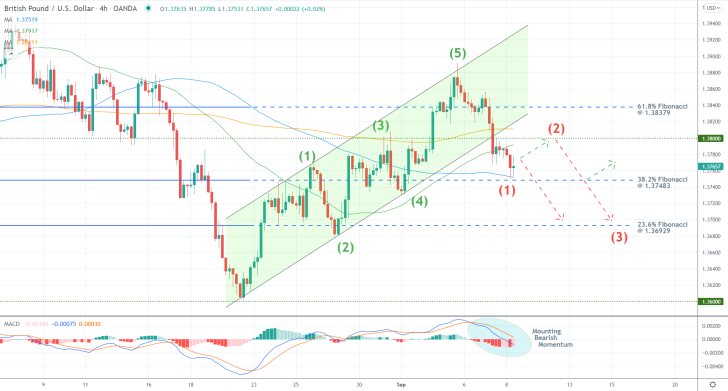
The preceding uptrend, which is actually a retracement within an even broader downtrend, took the form of a 1-5 impulse wave pattern, as postulated by the Elliott Wave Theory. As can be seen on the 4H chart above, it is underpinned by the ascending channel.
The reversal naturally took place after the completion of the final impulse leg (4-5), followed by a decisive breakdown below the lower limit of the channel. The reversal itself is made even more prominent by the fact that it occurred from the 61.8 per cent Fibonacci retracement level at 1.38379, which was the last Fibonacci barrier.
The dropdown that ensued is temporarily being checked above the 38.2 per cent Fibonacci at 1.37483. This could allow bears to enter short at the peak of a minor pullback that is likely to emerge over the next several hours.
Notice that the pullback emerged not only from the 38.2 per cent Fibonacci but also from the 100-day MA (in blue). However, the price action remains concentrated below the 50-day MA (in green), which serves as a floating resistance. This temporary consolidation evolves while the underlying bearish momentum is increasing, as signified by the MACD indicator.
Bears looking to sell around the current spot price should be mindful of potential adverse fluctuations to the psychologically significant resistance level at 1.38000. In this case, the pullback would actually signify the first retracement leg (1-2) of a new bearish 1-5 pattern. This resistance level is made even more prominent by the fact that the 200-day MA (in orange) is threading just above it.
Overall, bears may have to try several times before they gain favourable entry. That is why they shouldn't place their supporting stop-loss orders more than 30 pips away from their initial entries.
The first major target for the new downtrend is represented by the 23.6 per cent Fibonacci retracement level at 1.36929.
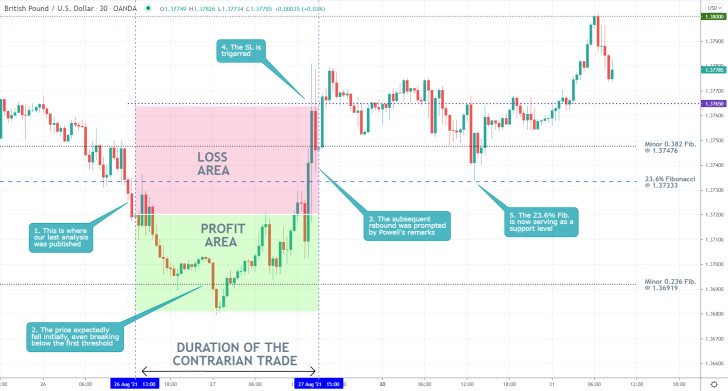
- Shortly after the release of our last analysis of GBPUSD, the price action expectedly started to fall. However, a snap rebound from the minor 0.236 Fibonacci was then followed by an upswing to the 1.37650 resistance, which triggered the stop-loss.
- This was prompted by Jerome Powell's comments urging caution and patience with regard to monetary policy.
- While it is true that the purpose of a narrow stop-loss is precisely this - to protect the underlying position from such unexpected developments - it should be stated that this particular trade suffered because it was proactive.
- It means that it was placed prior to Powell's speech, which exposed it to the risk of such unperceivable developments. In other words, proactive trading, though oftentimes very profitable, exposes the trader to more Black Swans than reactive trading (after a scheduled event or release).
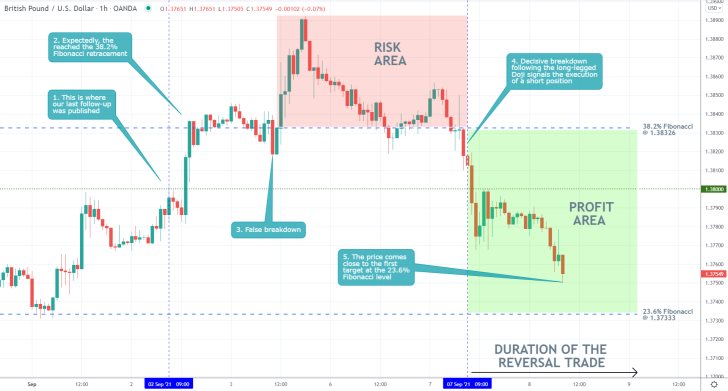
- Shortly after the release of our follow-up analysis of GBPUSD, the price action reached the 38.2 per cent Fibonacci retracement level at 1.38326. This was expected as part of the development of an Ascending Wedge pattern.
- However, the false reversal from the 38.2 per cent Fibonacci could have signalled a premature entry into the market. That is why it is so vitally important to use narrow stop-losses and to have the mental stamina needed to try again.
- It was on the second attempt, a successful entry was gained following the decisive breakdown below the 38.2 per cent Fibonacci.
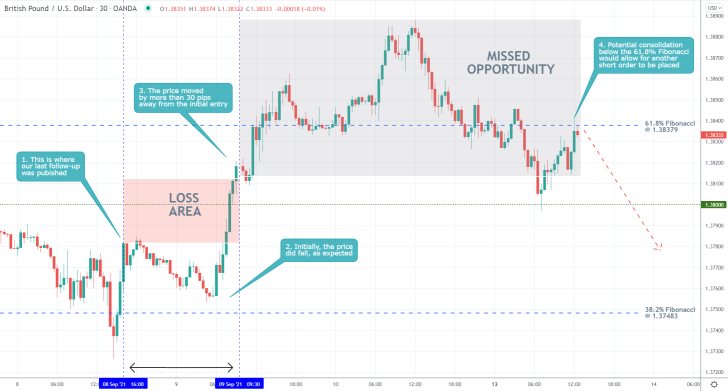
- Our last follow-up analysis of GBPUSD under-evaluated the breadth of the upswing that was evolving at the time of its release. The price action broke out above the psychologically significant resistance level at 1.38000, which was where a reversal was expected to take place.
- Nevertheless, the narrow stop-loss prevented bigger losses, which should be considered a success.
- Presently, the price action is consolidating just below the 61.8 per cent Fibonacci retracement level at 1.387379. A potential failure of the price action in breaking out above this resistance would allow bears to consider entering short once more.
Disclaimer: Your capital is at risk! Trading and investing on the financial markets carries a significant risk of loss. Each material, shown on this website, is provided for educational purposes only. A perfect, 100% accurate method of analysis does not exist. If you make a decision to trade or invest, based on the information from this website, you will be doing it at your own risk. Under no circumstances is Trendsharks responsible for any capital losses or damages you might suffer, while using the company’s products and services. For more information read our Terms & Conditions and Risk Disclaimer.


