The price action of GBPJPY is currently in the process of establishing a bullish pullback within a broader downtrend. Similarly to other assets, this corrective movement is resulting from the temporary depreciation of the greenback in the short term. This means that bears would have a chance to utilise trend continuation trading strategies once the pullback peaks and the price action is ready to resume falling.
The pound is likely to be hurt by the latest disappointing numbers of the British economy, which implies decreasing pace of recovery. Meanwhile, the yen is likely to benefit from the expected recovery of the dollar by the end of the week.
As was argued in one of our previous analyses, Jerome Powell, Chair of the FED, is set to speak at the Jackson Hole Symposium. He will expound upon the possibility of FED tapering by early 2021, which would very likely bolster the greenback.
That is why GBPJPY bears can position themselves accordingly in anticipation of the continuation of the current downtrend's development.
Eyeing a Pullback to the 38.2 per cent Fibonacci Retracement Level
As can be seen on the daily chart below, the price action of the GBPJPY tends to stop and turn without many adverse fluctuations at predictable levels (major levels of support and resistance). This is demonstrative of the fractal nature of the price action.
This implies that the price action is likely to continue bouncing up and down between such crucial thresholds, which is what gives credence to the expectation for a major reversal from the 38.2 per cent Fibonacci retracement level at 151.405 in the near future.
In other words, the directional movements and intermittent corrections are not random. Notice that the current downtrend commenced as a major 1-5 impulse wave pattern, as postulated by the Elliott Wave Theory. The last candle of the pattern (a distinct Hammer) probed momentarily the previous swing low at 148.500 before rebounding from the 150-day MA (in orange).
The subsequent ABC correction was terminated below the 61.8 per cent Fibonacci retracement level at 153.192. Afterwards, the price action started developing the latest bearish 1-5 impulse wave pattern, having already completed the first impulse leg (0-1).
It follows that the current pullback is actually the first retracement leg of this new pattern (1-2), which is likely to be completed at the 38.2 per cent Fibonacci. Moreover, the support-turned-resistance 150-day MA is currently converging towards 151.405, thereby making the latter a more prominent turning point.
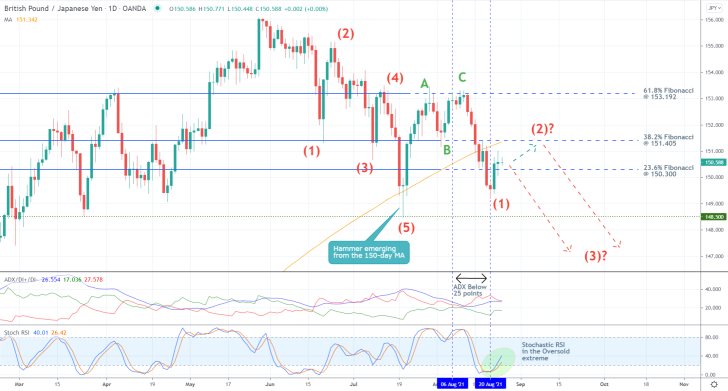
Notice that the ADX indicator has crossed above the 25-point benchmark recently, which is an early signal of mounting bullish bias. Even still, the underlying trend is still relatively weak, which is why the pullback could be extended a little bit higher before the price gets ready to resume falling.
This is additionally bolstered by the fact that the Stochastic RSI indicator is currently threading in its oversold extreme, which could prompt a minor resurgence of buying pressure in the short term.
Ultimately, bears who sell the GBPJPY at the end of the pullback would be eying a dropdown below the previous swing low (at 148.500) into uncharted territory. This would be the second impulse leg (2-3).
Examining the Current Consolidation in the Short Term
The 4H chart below demonstrates in greater detail the structure of the pullback in the short term. Moreover, it confirms the aforementioned fractal nature of the price action, as it rebounds from both fixed and floating supports and resistances.
Notice that the price action is currently consolidating between the 20-day MA (in red), which is converging with the 23.6 per cent Fibonacci, and the 50-day MA (in green). This is crucial, as a potential breakout above the latter (currently underpinning the minor resistance level at 150.700) would allow for the continuation of the pullback towards the 38.2 per cent Fibonacci.
Conversely, a breakdown below the two lower limits of this consolidation range would potentially imply that the market is ready to resume falling right away.
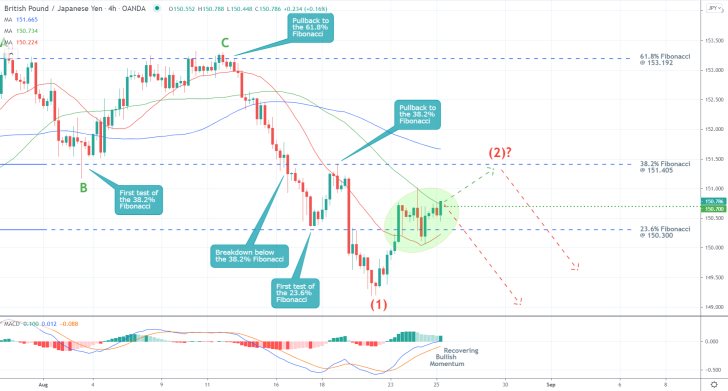
For the time being, the histogram of the MACD indicator is rising, which signals increasing bullish momentum. However, the underlying sentiment remains ostensibly bearish-oriented.
What is interesting to point out is that the 100-day MA (in blue) is drawing near the 38.2 per cent Fibonacci, making it an even more robust resistance.
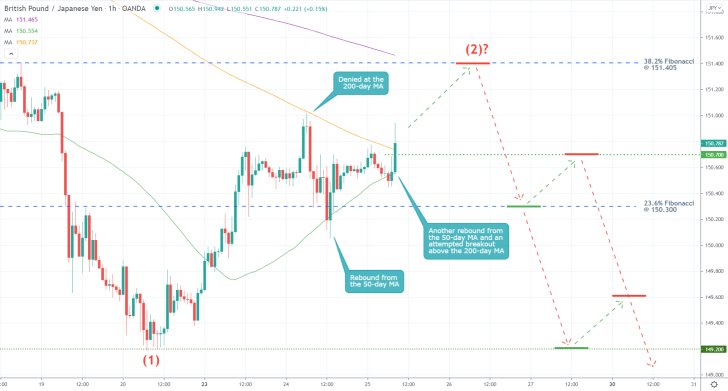
Finally, pay attention to the behaviour of the price action around the 200-day MA (in orange) on the hourly chart below. If it manages to close above it, as well as 150.700, the path would be cleared for the continuation of the pullback towards 151.405. The latter is about to be crossed by the 300-day MA (in purple), making it an even more prominent resistance.
However, should the price action fail to break out above the 200-day MA over the next several hours, its subsequent consolidation between the 23.6 per cent Fibonacci and the 150.700 resistance would signify the possibility for the immediate continuation of the downtrend.
Concluding Remarks:
Bears can utilise the current trading setup in one of two ways. They can either wait for the price to reach 151.405 before they sell there, placing a stop-loss order no more than 40 pips away from their initial entry.
Or they can sell around 150.700, provided that the price action does not break out above the 200-day MA (as seen on the hourly chart). It should be mentioned that this second possibility is riskier, which is why it is not suitable for risk-averse traders.
As stated earlier, the first major target for the downtrend is underpinned by the previous swing low at 148.500.
GBPJPY's Recovery Takes the Shape of a Wedge
The GBPJPY is recovering in the short term, driven by the depreciation of the U.S. dollar. The latter, which was prompted by FED Chair Jerome Powell's recent remarks, allows for the temporary strengthening of the pound. The pullback occurred even in spite of the somewhat disappointing industrial numbers in the UK.
However, this development could be coming to an end soon, given the nearing of the price action to several crucial resistances. This could prompt a snap bearish reversal, which would allow bears to utilise trend continuation trading strategies. The broader market sentiment remains tilted to the downside.
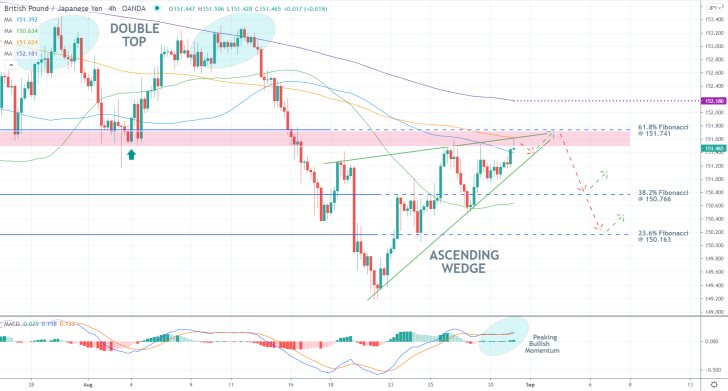
As can be seen on the 4H chart above, the pullback takes the form of an Ascending Wedge. This is a type of pattern that typically indicates potential reversals. Notice that the Wedge appears ready to be completed at the 61.8 per cent Fibonacci retracement level at 151.74.
The latter serves as a major support-turned-resistance level, which makes it a very probable turning point. This is further bolstered by the fact that it used to function as a neckline to the previous Double Top pattern. Double Tops are commonly taken to signify upcoming downtrends.
When viewed in conjunction with each other, those two factors corroborate the expectations for a likely upcoming reversal around the 151.74 level, underpinning a major resistance area (in red). This is happening while the underlying bullish momentum appears to be waning, as demonstrated by the MACD indicator.
Notice also that the price action is currently probing the 100-day MA (in blue) and the 200-day MA (in orange), which have only recently crossed below the 61.8 per cent Fibonacci. Those two moving averages make the 151.74 level an even likelier turning point.
Bears wanting to sell around the current spot price should not place their stop-losses more than 40 pips away from their initial entries, as per usual. However, they should consider the low probability of adverse fluctuations reaching the 300-day MA (in purple), highlighting the resistance level at 158.180.
That is why they may have to try several times before they get a favourable entry into the market. The first target for the renewed downtrend would be the 38.2 per cent Fibonacci at 150.766. The latter is about to be crossed by the 50-day MA (in green), which serves as floating support, making the possibility of a rebound from it bigger.
If, however, the price manages to break down below 150.766, then the second target would be the 23.6 per cent Fibonacci at 150.163.
GBPJPY's Uptrend Likely to Continue Climbing Higher
The development of an Inverted Head and Shoulders pattern at the bottom of the preceding downtrend signalled the beginning of a new uptrend on the price action of the GBPJPY pair. Next, a minor pullback is likely to occur before the underlying rally can be resumed.
The pullback is likely to be initiated over the next several days, given the lack of any major releases in Britain over the next five days. Meanwhile, the GDP growth data in Japan is likely to prompt a temporary volatility upsurge on the yen, which is unlikely to last for long.
The economic calendar this week is, therefore, seemingly favourable for the likely emergence of a minor pullback on the price of GBPJPY, which, in turn, would allow bears to use contrarian trading strategies. Bulls, in contrast, could use trend continuation strategies once the pullback bottoms out.
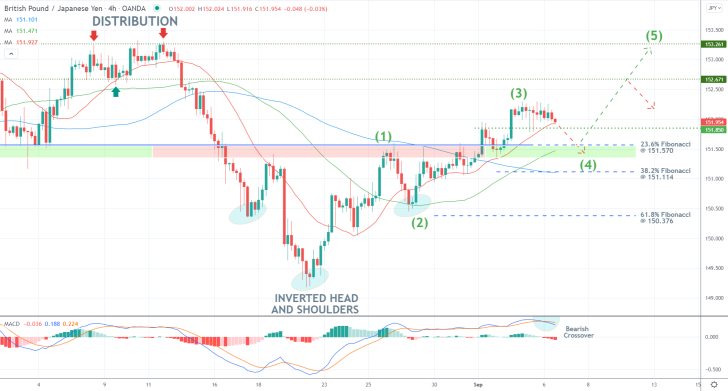
As shown on the 4H chart above, the pullback could extend to the 23.6 per cent Fibonacci retracement level at 151.570, which underpins the upper boundary of a major resistance-turned-support area.
The current uptrend commenced following the completion of the Inverted Head and Shoulders pattern, which signifies the strong bullish commitment in the market. So far, the uptrend has taken the form of a 1-5 impulse wave pattern, as postulated by the Elliott Wave Theory.
The price action has recently completed the second impulse leg (2-3), as signified by the emergence of a small consolidation range. It follows that the aforementioned pullback is likely to serve as the second retracement leg (3-4) of the pattern. The beginning of this second retracement leg is signalled by the bearish crossover on the MACD indicator.
Bears can consider entering short provided that the price action breaks down below the convergence of the 20-day MA and the last pivot high at 151.850. As per usual, they should not place their stop-losses more than 30-40 pips away from their initial entry. The 23.6 per cent Fibonacci level serves as the target for their contrarian positions.
Bulls can then look for a chance to enter long around this major support level, which is about to be crossed by the 50-day MA (in green). The first target for the renewed uptrend is the lower boundary of the last Distribution range at 152.670. The major resistance level at 152.261 (the upper limit of the Distribution) is the next target.
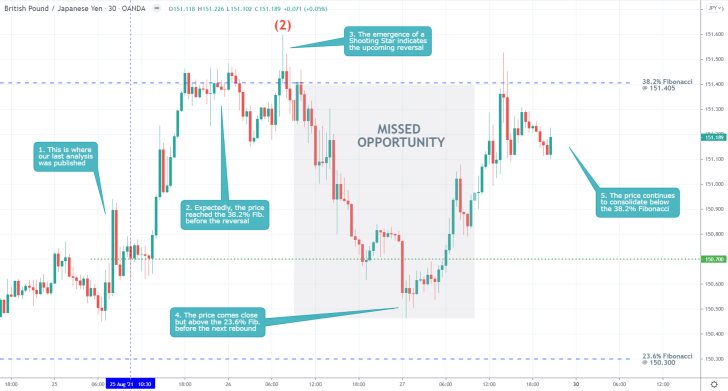
- Despite successfully forecasting a reversal from the 38.2 per cent Fibonacci retracement level at 151.405 and a subsequent dropdown of more than 30 pips, our last analysis of the GBPJPY pair failed in several ways.
- It failed to point out that a floating TP order could have substituted the fixed order after the price action had moved by a certain amount in the trader's favour. This would have protected the trader from the subsequent rebound.
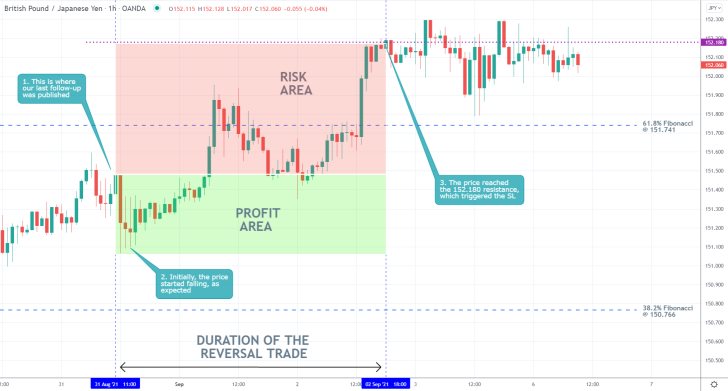
- Shortly after the publication of our last follow-up analysis, the price of the GBPJPY expectedly completed the Ascending Wedge. However, a reversal did not occur immediately afterwards. Instead, the adverse fluctuations reached the 152.180 resistance, which triggered the SL order.
- Even still, the price action continues to consolidate just below the resistance level, which could potentially signify that a decisive reversal is still in the making.
- In other words, the selling opportunity may still be active. The need for the execution of several orders before gaining a favourable entry was hinted at in the follow-up.
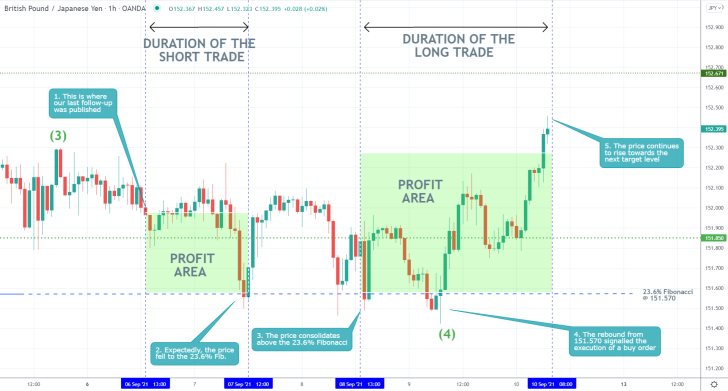
- As was forecasted by our last follow-up analysis of GBPJPY, the price action initially fell to the 23.6 per cent Fibonacci retracement level at 151.570. Following a temporary consolidation above this threshold, the price action rebounded and started heading towards the next bullish target level.
Disclaimer: Your capital is at risk! Trading and investing on the financial markets carries a significant risk of loss. Each material, shown on this website, is provided for educational purposes only. A perfect, 100% accurate method of analysis does not exist. If you make a decision to trade or invest, based on the information from this website, you will be doing it at your own risk. Under no circumstances is Trendsharks responsible for any capital losses or damages you might suffer, while using the company’s products and services. For more information read our Terms & Conditions and Risk Disclaimer.


