The coronavirus pandemic has been rattling global markets for more than a month now, and headline volatility has increased tremendously as traders and investors scramble to make sense of the COVID-19 fallout and its impact on the global economy.
The price of some assets has plummeted on the prevailing market uncertainty while others have managed to rally in the wake of the recent stock market selloff. Amidst all of these massive price swings, very few people would expect to see subdued trading action in a narrow range, but strangely enough, this is precisely what is happening to the EURJPY pair right now.
In the foreign exchange market, the Japanese yen has been considered to be a safe-haven asset for a long time, while the euro appears to have surpassed the greenback as the go-to currency for traders and investors worldwide - particularly in emerging markets – amidst the escalating coronavirus crisis. These two factors have bolstered the demand for the two separate currencies, which appear to be strengthening at the same pace.
As a consequence, an unlikely range trading environment has emerged in the EURJPY's price action. The bizarre thing here is that the range is not prompted by subdued demand or muted market pressures. Instead, it emanates from equally strong separate surges in demand for the two respective currencies, which have balanced the acute market pressures.
The uniqueness of the coronavirus situation causes the range-trading environment on the EURJPY, which is displaying the behaviour of a normal range. This means that traders can apply range trading strategies in order to examine the peculiarities of the current market setup and to take advantage of the underlying price action's predictability. Thereby, the purpose of the present analysis is to examine the EURJPY's most recent price action and to outline the crucial points of interest within the boundaries of the underscored range.
1. Daily Outlook:
Unlike other times, for this particular analysis, we have chosen to emphasize more on the underlying developments in the short term. That is why we are going to begin by reviewing the daily price chart below.
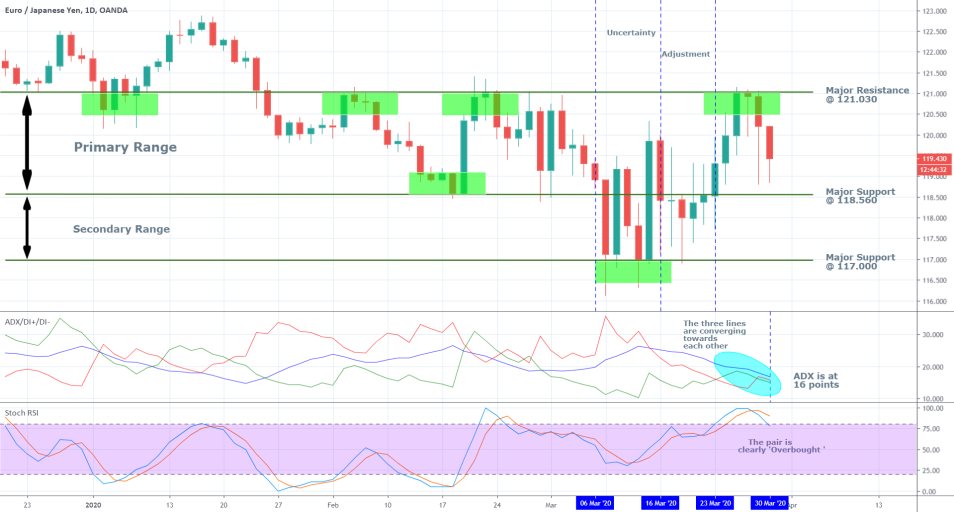
The first significant observation that can be made is in regards to the condition of the trading environment. The ADX indicator is currently at 16 points, which underpins the decidedly range-trading environment that is prevalent at the present time. This is the lowest recorded value of the ADX since Late-January, which means that directional price swings are not likely to last for very long under the current market conditions.
Moreover, the D+, D-, and the ADX itself have been converging towards each other over the past several days (see the blue ellipse on the chart). This is yet another indication that the buying and selling pressures are harmonizing, and that the underlying range environment is robust at the moment – perfect conditions for applying range trading strategies.

We have outlined two ranges on the chart – a primary one, where most of the price action is contained, and a secondary one. The upper boundary of the primary one is represented by the major resistance level at 121.030, and its lower edge is represented by the major support at 118.560. The latter is shared with the secondary range, which has a lower boundary at the 117.000 major support. Under range trading conditions, all of these three price levels serve as potential turning points for the direction of the underlying price action.
It can be seen that the price had reached the major resistance at 121.030 three days ago before it bounced back from it. At that time, the Stochastic RSI was threading in the 'Overbought' extreme, which is an especially important indication for potential changes in the direction of the underlying price action in ranges. Thereby, each time that the Stochastic RSI reaches one of the two extremes or there is a crossover, traders are likely to be monitoring these developments closely and adjusting their positions correspondingly.
Such actions are likely to create distortions in the demand pressures in the short-term, which, in turn, affect the price action. Hence, traders should monitor the RSI when the price is trading near one of the three aforementioned levels, and watch for early signs of reversals.
The price action that took place in the days between the 6th of March and the 16th of March is referred to as ‘Uncertainty’. That is when the COVID-19 fallout was having its most noticeable impact on the price action, which resulted in massive price fluctuations in both directions. This was when the price action was mostly concentrated within the secondary range.
The price action that took place between the 16th and the 23rd of March is referred to as 'Adjustment'. The massive upper and lower shadows of the candlesticks with relatively small bodies that developed during that period, illustrate the erratic adjustment process of the market pressures at that time. That transitionary period was also mostly concentrated within the secondary range, but once the price action passed into the primary range, it became more directional (within the confinement of the broader range). All of these observations confirm our expectations for changes in the price action’s direction around the three aforementioned price levels. This trend is likely to persist.
2. Short Term Outlook:
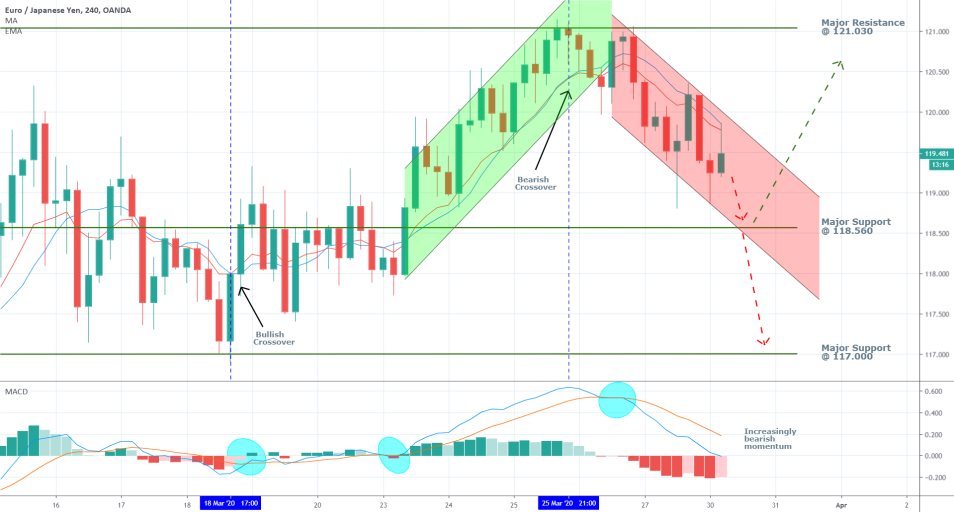
The 4H chart below highlights the swift changes in the direction of the price action when the pair nears a crucial level of support or resistance.
At 17 pm on the 18th of March, the price temporarily reached the major support at 117.000before bouncing back up. Shortly afterwards the 10-day EMA crossed above the 10-day MA, which is evocative of prevailing bullish sentiment in the short term. The price action then consolidated below the major support (temporary resistance) level at 118.560 before heading further north. The positive crossover on the MACD around the 0.000 level confirmed the rising bullish momentum shortly before the breakout (the middle blue ellipse).
Subsequently, the price action reached the major resistance level at 121.030, and the upswing was terminated. Right around that time, the price action formed a hanging man candlestick (25th of March at 21 pm), which entails the termination of a recent bullish trend or upswing – the first piece of evidence justifying the execution of a new short order. Shortly afterwards, the 10-day EMA crossed below the 10-day MA, which was the second such piece of evidence. Later the price formed a throwback to the resistance level, but then the MACD registered a negative crossover, which was the third piece of evidence pointing to the newly forming downswing.

These observations highlight the necessary indications and pieces of evidence that traders can look for when deciding when and how to enter the market at the beginning of a new directional swing.
For the time being, the most recent downswing appears headed towards the major support level at 118.560. Once the price reaches that level, it can either bounce back up towards 121.030 or conversely, it can head further down south and converge towards the major support level at 117.000. It all depends on the readings that can be drawn from the MACD; the MA and the EMA; and the underlying candlesticks that appear once the price reaches the 118.560 support level.
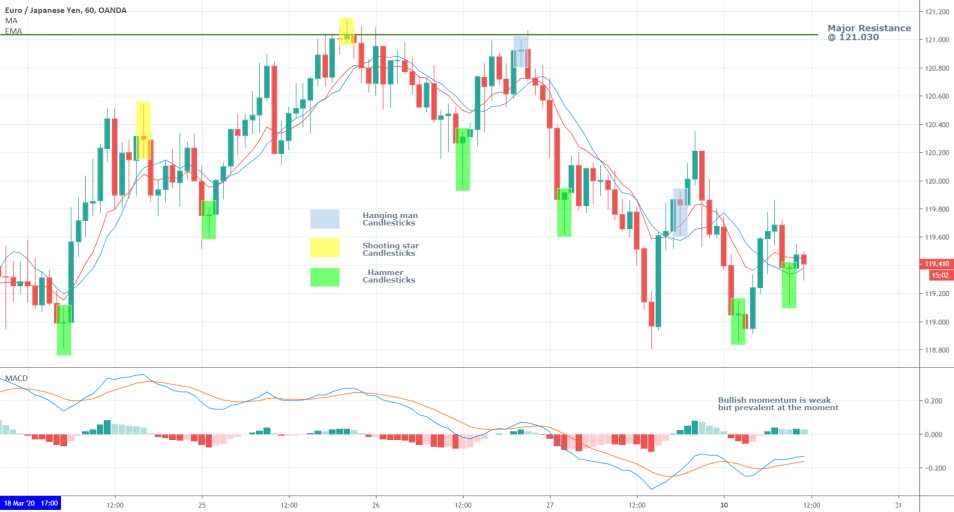
The 1H chart below highlights the specific types of candlesticks that traders need to be looking for at every dip and peak in the underlying price action, while it continues to be confined within the boundaries of the range. Hammers typically signify bullish sentiment, whereas shooting stars and hanging man candles have bearish inclinations.
Whenever these candles are found near a major support (hammer) or resistance (shooting star and hanging man) levels, they could be taken to represent potential entry levels for the execution of long or short orders respectively. Whenever these observations are congruent with the readings from other evidence sources – MACD; EMAs and MAs; the Stochastic RSI-, range trading strategies can be applied.

3. Concluding Remarks:
The market is currently developing a bearish downswing, which appears to be right in the middle of the primary range. Due to the relatively small size of the range joining the market at present is not going to be the most efficient thing to do. Rather, traders are advised to wait until the downswing is exhausted and the price reaches one of the two support levels. Afterwards, traders can look for indications justifying the execution of a long order.

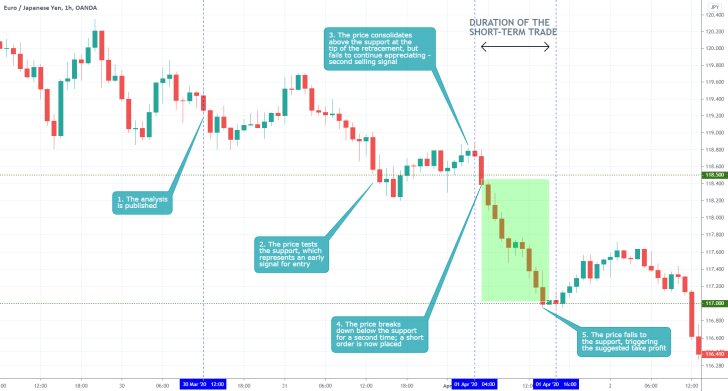
- Perfectly executed trade. The market behaved exactly as anticipated by the analysis in that the underlying price action first tested the support at 118.500. After the false breakdown was established, the price action went on to establish a minor retracement. Afterwards, the subsequent breakdown below this support signalled the need for a selling order to be placed. No further comments needed.
Disclaimer: Your capital is at risk! Trading and investing on the financial markets carries a significant risk of loss. Each material, shown on this website, is provided for educational purposes only. A perfect, 100% accurate method of analysis does not exist. If you make a decision to trade or invest, based on the information from this website, you will be doing it at your own risk. Under no circumstances is Trendsharks responsible for any capital losses or damages you might suffer, while using the company’s products and services. For more information read our Terms & Conditions and Risk Disclaimer.


