Facebook has gone through a difficult patch in the past several months, as the social media giant is currently dealing with antitrust investigations; media scandals and controversies in addition to the rising uncertainty regarding the ultimate success of its future introduction to its Libra cryptocurrency. It seems as though Facebook is fighting on several fronts at the same time in a bid to preserve its corporate integrity while at the same time striving to expend its horizons on the market. On the other hand, revenue is anticipated to grow, and the company's overall financial situation seems to be more than promising.
Amidst all of these issues at hand, Facebook is scheduled to report its earnings for Q4 2019 after today's market close and the stakes couldn't be higher, especially after the excellent performance that was recorded by Apple yesterday. Investors are eager to see whether Facebook’s earnings would meet the consensus forecasts and subsequently manage to offset the negative impact from the aforementioned controversies.
Therefore, the purpose of the current analysis is to examine all contributing factors associated with the performance of the company's earnings report later today. Additionally, it is meant to demonstrate how a trader can position himself or herself on the market prior to the release so that he or she can squeeze the maximum out of the expected market reaction.
1. Long-term outlook and the Share Price Reactions After the Previous Earnings Releases:
- EPS Expectations. Facebook is expected to report Earnings Per Share of $2.51, which is going to be its most significant performance on record if realised. Thus far, its most solid performance was recorded one year prior when Facebook reported EPS of $2.38 for the fourth fiscal quarter of 2018.
On that account, the current outlook for the company resembles closely the market situation for Apple from a day before, when we let you know that the company was expected to improve on its best performance to date from a year ago, which Apple did . So the Apple precedent serves as a strong indication that Facebook, too, can benefit from the apparently strengthening Big Tech sector in the US.
There is an interesting pattern that can be discerned from the examination of the previous four EPS data releases. Two times the recorded data surpassed the consensus forecasts and two times it missed them. The two times that the EPS were better-than-expected it set the tone for the establishment of two new bullish trends. In contrast, the immediate market reaction to the other two more disappointing performances was less decisive, as the price did not register any significant tumbles. Thus, judging solely on the EPS data, it can be surmised that even if today's earnings data does not meet the consensus forecasts for EPS of $2.51, that should not have a devastating impact on the currently developing bullish trend. Its significance was confirmed last week when the price reached an all-time high of 222.74. The share price is therefore anticipated to continue climbing higher in the mid-term, the question, however, is whether it would continue to do so immediately after the release of today’s report, or if there is going to be a short-term bearish correction first.
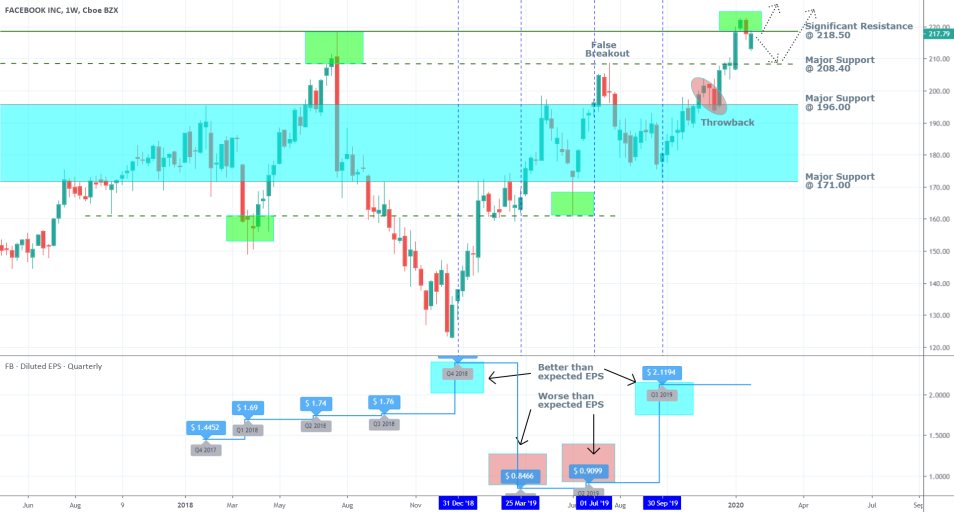
Facebook’s share price has been trading within the boundaries of the consolidation range presented above for the better parts of 2018 and 2019, with a resistance at 196.00 and support at 171.00. This subdued price action was owing to the aforementioned controversies stemming from the allegation that Facebook was abusing the privacy data of its customers. The resulting uncertainty from the antitrust investigations led to diminished directional trading and muddled demand over the course of the two years. Regardless, the price has managed to break out above the range's upper boundary and now has to overcome only the significant resistance at 218.50 before the new bullish trend can be said to have picked up full steam. The general expectations are for Facebook to manage to achieve that after the release of today’s earnings report.
- Facebook’s Controversies and Supreme Court Trials. The aforementioned bullish trend would have been even more decisive if it weren’t for the ongoing probing into Facebook’s operations and trials in the Supreme Court, which, as was already stated, have contributed to heightened uncertainty concerning the company’s future. Additionally, Facebook’s operating costs have increased considerably in the last two years following the imposition of taxes and charges related to the Cambridge Analytica scandal. All of this has contributed to the weakening of Facebook’s share price, which in late 2018 was underperforming compared to the rest of the blue chip companies comprising the S&P 500 index.
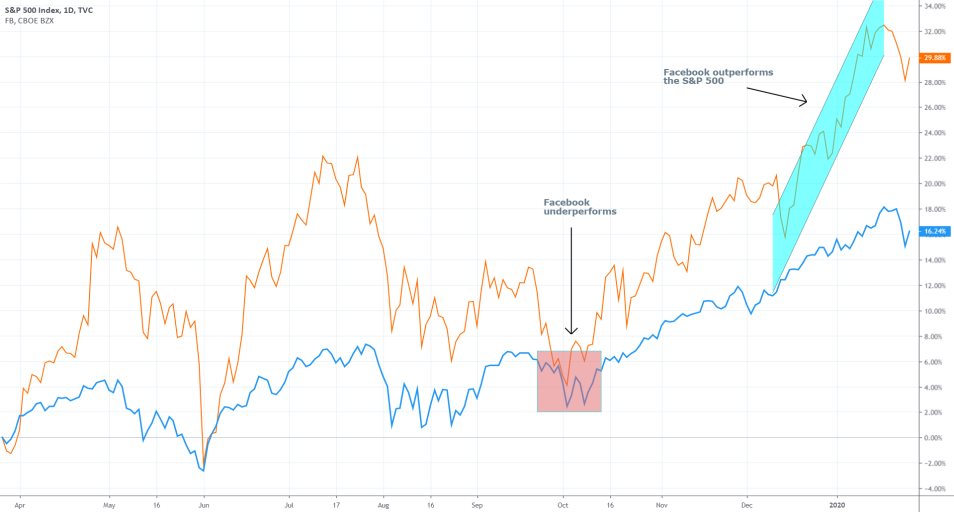
Nevertheless, the most recent trend of strengthening of Facebook’s stock compared to the S&P, as indicated by the blue channel on the chart above, is exhibiting the waning negative impact of the regulatory scrutiny and the one-time charges on the company's share price. This newly found resilience of Facebook's share price to external pressures could accommodate a potentially robust earnings data for Q4 2019, which would likely result in a post-release surge in the underlying price action.
2. What Are the Major Determinants for the Success of Today’s Report?
Apart from the aforementioned financial factors, there are two additional metrics in Facebook's quarterly report, which could impact the subsequent price action post-release.
- Daily Active Users (DAUs) and Monthly Active Users (MAUs). The first two critical metrics to consider later today are the number of daily and monthly active users on Facebook's platform, including the DAUs on the other Facebook-owned WhatsApp, Messenger, Instagram and Oculus platforms.
In its previous earnings report, Facebook announced that the number of DAUs for Q3 2019 reached 1.62 billion on average, which measured an increase of 9 per cent on a yearly basis. The number of MAUs reached 2.45 billion for the same period, up by 8 per cent from a year prior.
Some sources forecast a likely appreciation of those two metrics of more than 23 per cent on a year-over-year basis, which would measure a more than twice the improvement compared to the recorded performance for Q3 2019. These two metrics are especially important because they provide the basis for Facebook’s auditory, which is where its revenue comes from and the next important determinants.
- Adds Clicks. CNBC reports that the median number of ads clicks per user has increased by two in the second part of 2019, which would undoubtedly be reflected in today’s earnings report. The media goes on to state that:
“Facebook users are clicking on more ads than before, according to the company’s own tools that are provided to advertisers, suggesting the company will announce strong fourth quarter results on Wednesday.”
Thus, the expectations for bolstered revenue from advertising in Q4 2019 provide yet another indication presupposing another excellent performance for the previous year's last financial quarter. If Facebook does indeed meet those consensus forecasts, it would continue a trend that was initiated last quarter, when the revenue from advertising was reported at $17.383 billion, which was up by 28 per cent on year-over-year basis.
3. Short-Term Outlook:
In preparation for trading, the short-term price action has to be carefully analysed before the execution of any orders.
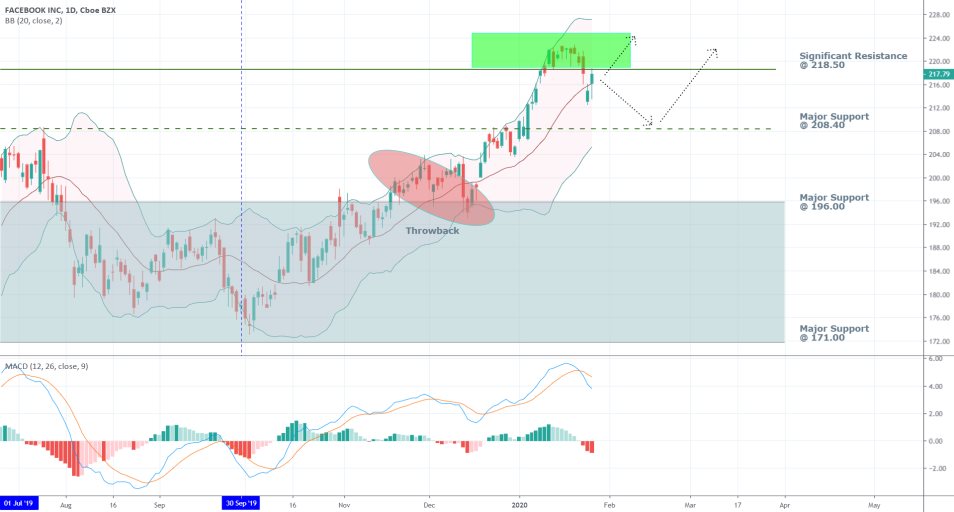
The daily price chart above demonstrates the anticipation of a very strong bullish sentiment. Nevertheless, it should also be noted that the MACD has turned negative, which is a bearish indication. However, the price action has managed to bounce back above the Middle Line of the Bollinger Bands in yesterday’s trading session, which confirms the bullish commitment in the market.
There are two very likely scenarios, which can transpire after the release of the expected robust earnings report (intentionally disregarding the possibility of a negative earnings report for the time being). The price could either jump immediately and thereby break out above the significant resistance level at 218.50, or a short-term bearish correction could form momentarily before finding support either at the 208.40 price level or at the 196.00 major support.
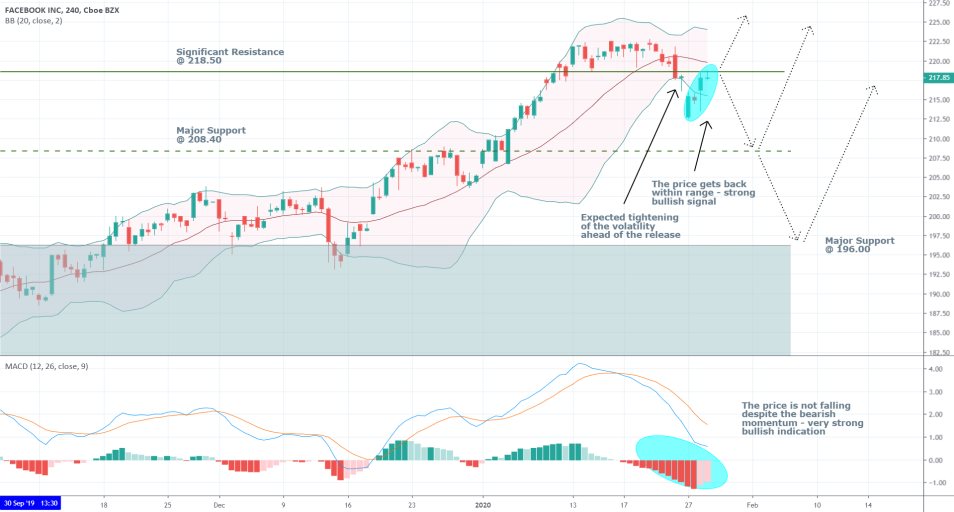
An investigation of the 4H price chart reveals a similar picture. The MACD is ostensibly negative; however, the price is not falling, and in fact, it rose back within the boundaries of the Bollinger Bands, which is a very strong confirmation of the prevailing bullish sentiment. Overall, the market setup seems pretty straightforward, and the execution of a long order should not be overly intricate.
4. Going Long on Facebook’s Shares:
Depending on the manner in which Facebook's share price opens today's trading session, there are two possible scenarios for the execution of long orders. Keep in mind that if the market conditions do not meet the following criteria after the release of the earnings report, the execution of a short order in an otherwise bullish market would be inadvisable.
Scenario 1 – Facebook’s Shares Do Not Open Wednesday’s Trading Session with a Gap. In this case, the share price opens at 217.85, and the trader has to decide whether to go long at the market price or wait and see how the market develops next.
Entry Level – Anywhere in the range between the significant resistance at 218.50 and the major support at 208.40, depending on the trader’s preference.
Stop-loss – should be placed at least 11 dollars away from the initial entry price level.
Target level – Depending on the market’s development following the release of the earnings report.
Scenario 2 – Facebook’s Shares Open Wednesday’s Trading Session with a Gap. In case that the share price opens anywhere below the significant resistance level, the trader can still choose to follow the exact same rules from above, or he or she can opt to take extra precautions by purchasing a long call option.
Strike Price – Either the market price at the time of execution or the major support at 208.40
Delivery Date – Depending on the trader’s margin and preference. It could be anywhere from several days to a month after the earnings report’s release.
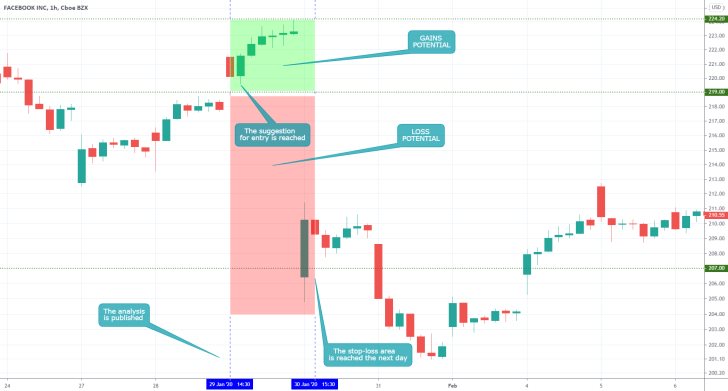
- Overall, very risk analysis with poor performance. The analysis was supposed to offer traders the opportunity to practice proactive trading, which did not yield much results. The inherent problem was the desire to trade BEFORE the release of FB's quarterly earnings data, which could not reflect on the way in which the market would price in the data eventually. Even though about 300-400 cents could have been made in the first several hours, there was no clear direction for longer-term gains. The big takeaway here is to refrain from speculating with such highly anticipated events in the stock market – it is better to wait for the market to discount the data, and only then to join the newly established price swing.
Disclaimer: Your capital is at risk! Trading and investing on the financial markets carries a significant risk of loss. Each material, shown on this website, is provided for educational purposes only. A perfect, 100% accurate method of analysis does not exist. If you make a decision to trade or invest, based on the information from this website, you will be doing it at your own risk. Under no circumstances is Trendsharks responsible for any capital losses or damages you might suffer, while using the company’s products and services. For more information read our Terms & Conditions and Risk Disclaimer.


