Following the latest economic developments globally, significant bearish sentiment is currently being observed on the EURUSD pair. This drastic change in the underlying supply and demand equilibrium is likely to drive the price action even lower in the foreseeable future.
Most importantly, FED's recent hint at a very probable rate hike as early as March strengthened the dollar. This decision was motivated by the accelerating pace of economic stabilisation in the U.S. The greenback is also being bolstered by heightened investors' enthusiasm following the very robust earnings season.
This trend is expected to carry over into this week, given the expectations for robust earnings performance by the likes of Alphabet Inc., Google's parent company. The final contributing factor to the greenback's underlying rally is the intricate geopolitical situation between Russia and Ukraine, which prompts heightened demand for safer and easily convertible currencies, chief amongst which is the dollar.
The outlook on the euro, in turn, is much more indecisive and uneven. On the one hand, the better-than-expected industry numbers in Germany for December came in as a welcoming development. However, it was later revealed that the pace of economic growth in the broader Euro Area missed the preliminary forecasts. Thus, the single currency remains in a state of uncertainty.
Overall, bears may try to implement trend-continuation trading strategies following the completion of the next pullback. Bulls, in contrast, could implement the riskier contrarian trading strategies on the expectations for such a pullback.
The Strength of the Underlying Downtrend
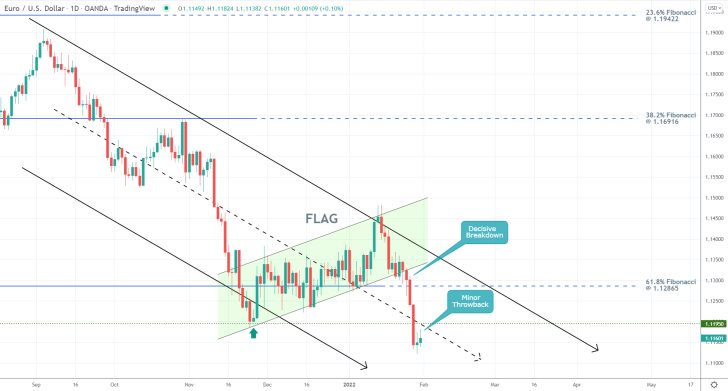
As can be seen on the daily chart above, the downtrend is contained within the limits of a major descending channel. Notice that the latest downswing commenced following the breakdown below the Flag - a type of pattern that indicates temporary breaks within an established trend. Even more notably, the price action managed to break down below the 61.8 per cent Fibonacci retracement level at 1.12865.
The latter bears historical significance as it was established in June of 2020. Hence, this breakdown below it signifies a major bearish indication of growing selling pressure. Moreover, the price action was recently able to penetrate below the dip of the Flag at 1.11950 and the middle line of the descending channel.
At present, the price action is establishing a throwback towards this major support-turned-resistance level at 1.11950, and its behaviour around it would indicate whether the price action would resume falling right away, or an intermittent pullback is due first.
A decisive reversal from the crossover between the middle line of the channel and the previous swing low at 1.11950 would then probably be followed by a test of the psychologically significant support level at 1.11000. Conversely, a breakout above the two could result in a re-test of the 61.8 per cent Fibonacci.
Examining the Possibility of a Bullish Pullback
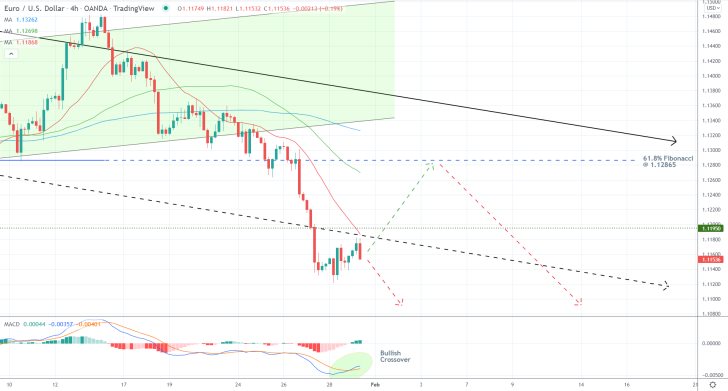
There are already mixed signals that can be observed on charts with a lower timeframe. As can be seen on the 4H chart below, the 20-day MA (in red) is currently converging with the crossover between the previous swing low and the middle line of the channel. This makes the crossover an even stronger turning point.
On the other hand, the recent bullish crossover between the 12-day EMA (blue) and 26-day EMA (orange) on the MACD indicator implies the likelihood of a bullish correction emerging next. That is why bears should be careful where they plan to join the existing downtrend.
Meanwhile, the close proximity of the 100-day MA (in blue) and 50-day MA (in green) to the 61.8 per cent Fibonacci makes the latter an even more prominent resistance level. That is why a bullish pullback is unlikely to break any higher.
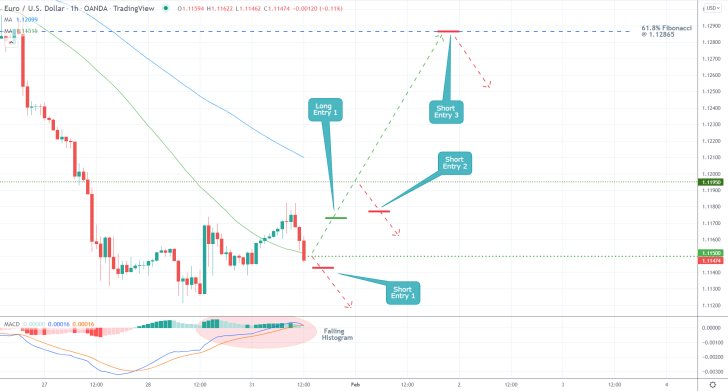
As regards the behaviour of the price action in the very short term, the likelihood of such a pullback emerging next seems a little bit more plausible. As can be seen on the hourly chart below, the 100-day MA is about to converge with the support-turned-resistance at 1.11950. Meanwhile, the 50-day MA underpins the major support level at 1.11500.
Finally, notice that the histogram of the MACD indicator has been declining over the last several hours while the two EMAs are converging around the 0.00 threshold. For this reason, the price action's behaviour around the 1.11500 threshold would be of such great importance. A rebound from it would very probably underpin the beginning of a new pullback, whereas a reversal could signify the continuation of the downtrend.
Concluding Remarks
Depending on their level of risk-aversion, bulls can consider entering long anywhere within the area spanning between 1.11500 and 1.11800. Their supporting stop-loss orders should not be placed more than 30 pips below their initial entries.
Once the price action draws near to the 1.11950 resistance level, they could substitute their fixed stop orders for floating TPs in order to protect themselves against sudden changes in the direction of the price action. Bulls' ultimate target would be the 61.8 per cent Fibonacci at 1.12865.
Bears, in contrast, should consider entering short only if the price action penetrates below the 50-day MA (around 1.11400). Conversely, they could enter short following a reversal from the 1.11950 resistance or place short limit orders at 1.128650. In either case, their supporting stop-loss orders should not exceed 30 pips either.
Bears can implement floating TPs right from the get-go since they would be trading on the expectations for a breakdown into uncharted territory further down south.
Is it Time to Buy EURUSD's Pullback?
Following a massive new upswing, the pair's price action established a minor pullback to the nearest resistance-turned-support level over the last several hours. This entails the possibility for the implementation of trend-continuation strategies by bulls looking to buy the resulting dip.
The upswing itself was commenced last week following the January policy meeting of the European Central Bank. The resulting decision strengthened the euro, while the dollar started giving way to the accelerating single currency. This was temporarily suspended following the release of the better-than-expected jobs numbers for last month.
But given this week's relatively uneventful economic calendar, the EURUSD pair looks ready to resume climbing higher.
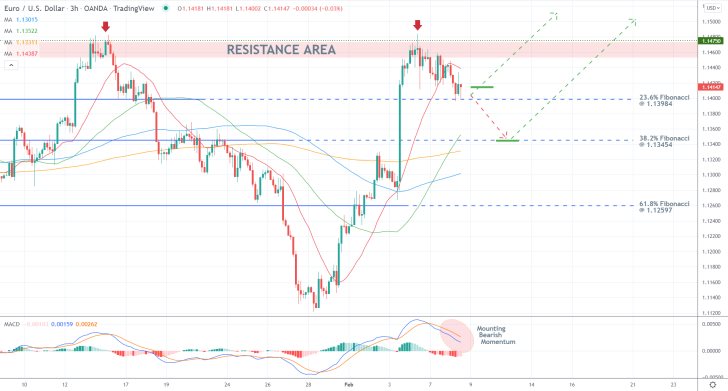
As can be seen on the 3H chart above, the new uptrend was temporarily held back at the previous swing peak at 1.14750, underpinning the nearest Resistance Area (in red). The resulting pullback thus fell to the 23.6 per cent Fibonacci retracement level at 1.13984, which is where the correction is likely to bottom out.
However, a potentially deeper correction can fall as low as the 38.2 per cent Fibonacci at 1.13454, given the mounting bearish momentum, as underscored by the MACD indicator. The latter is currently converging with the 50-day MA (in green) and 200-day MA (in orange), making it an even stronger support.
Depending on their level of risk-aversion, bulls can take advantage of the underlying opportunity in one of two ways. They can either open long market orders around the current spot price or place long limit orders at the 38.2 per cent Fibonacci at 1.13454. In either case, their supporting stop-loss orders should not be placed deeper than 30 pips below their initial entry levels.
In the first case, bulls would be able to utilise floating TPs once the price action breaks out above the previous swing peak at 1.14750; in the second, they could do the same at the 23.6 per cent Fibonacci. That way, bulls would be able to squeeze the maximum out of a potential breakout into uncharted territory past the most recent swing peak.
How to Implement the Wyckoff Method on the EURUSD
At present, the price action of the EURUSD pair appears to be behaving exactly as per the expectations of the Wyckoff Cycle theory, which can be exploited by traders seeking to implement trend-continuation strategies.
The price action is likely to continue depreciating on the expectations for dollar strengthening and euro depreciation in the near term. The greenback is once again enjoying a stable positive momentum following the release of the latest inflation rate and unemployment rate numbers.
Meanwhile, the temporary upsurge in bullish momentum on the euro that was prompted following the last meeting of the ECB appears to be waning, clearing the way for another euro depreciation.
Given the expectations for robust U.S. consumption numbers that are scheduled for publication later this week, the EURUSD is likely to continue depreciating in the very short term.
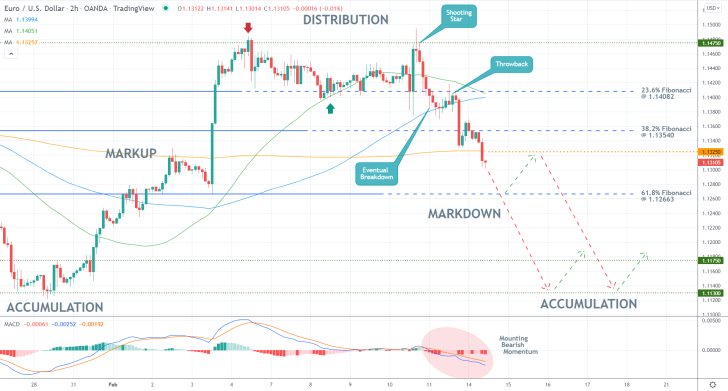
The latest Markdown started developing after the decisive breakdown below the lower limit (23.6 per cent Fibonacci retracement level at 1.14082) of the Distribution range.
The breakdown itself was followed by a throwback to the 23.6 per cent Fibonacci converging with the 50-day MA (in green) and 100-day MA (in blue), underpinning the strong bearish bias. The latter is also underscored by the current reading of the MACD indicator.
Another crucial development was the subsequent penetration of the price action below the 38.2 per cent Fibonacci at 1.13540 and 200-day MA (in orange), the latter highlighting the major support-turned-resistance level at 1.13250.
Depending on their level of risk-aversion, bears can take advantage of the underlying set up in one of two ways. They can either enter short around the current spot price (1.13160) but face the risk of adverse fluctuations, or they can wait for the next pullback to sell its peak.
If they choose the former option, then they need to place their stop-loss orders just above 1.13250. Their ultimate target would be the previous border of the Accumulation range at 1.11300. However, once the price action breaks down below the 61.8 per cent Fibonacci at 1.12663, they would be able to either move their SLs to breakeven or implement floating TPs.
If bears choose the latter option, then they would wait for a pullback to emerge from the 61.8 per cent Fibonacci, in which case they would be looking to enter short around 1.13250. Their supporting stop-loss orders should not exceed 30 pips above their initial entries. Their ultimate target would be the same; they could also apply the same risk-management strategy.
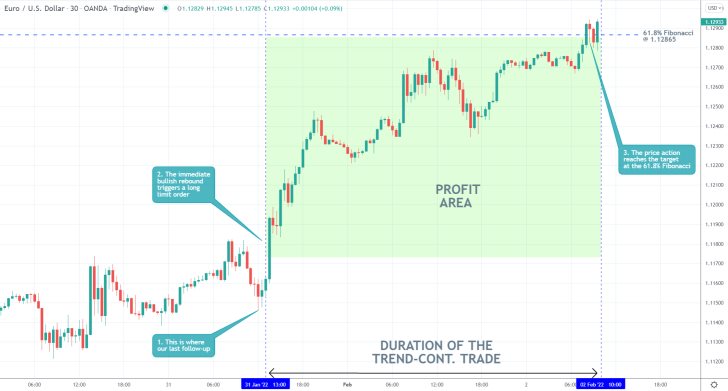
- The bullish expectations of our last EURUSD analysis were fulfilled. Shortly after its publication, the strong bullish rebound signalled the likely continuation of the underlying uptrend.
- Earlier today, the price action reached the ultimate target - the 61.8 per cent Fibonacci retracement level at 1.12865.
- Bears can still monitor the behaviour of the price action around this major threshold and watch for signs of a decisive reversal from it.
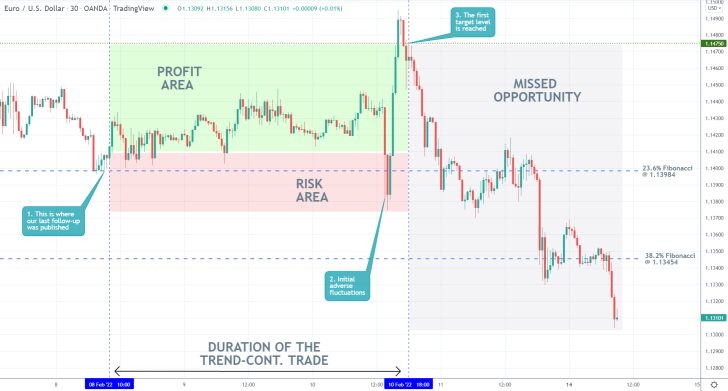
- Despite the turbulent last few days on the market, our last EURUSD follow-up was mostly successful. As expected, the price action eventually reached the upper limit of a major consolidation range at 1.14750.
- However, the weakest aspect of the analysis was its failure to forecast the subsequent reversal from this major turning point and a dropdown past the 38.2 per cent Fibonacci retracement level at 1.13454.
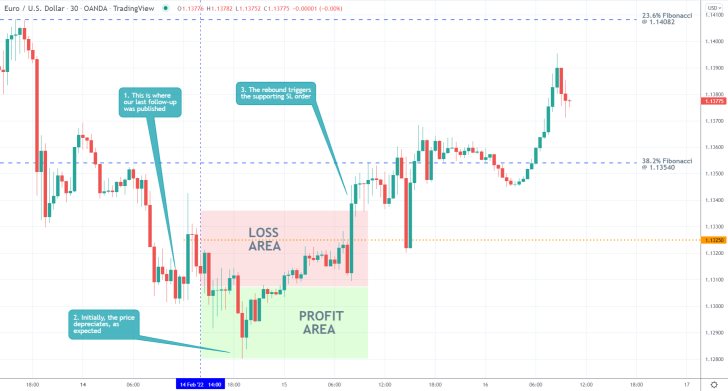
- The expectations of our last EURUSD follow-up for the continuation of the underlying downtrend were not realised. Instead, the subsequent bullish rebound triggered the stop-loss of the trade.
- Traders should always keep in mind that utilising trend-continuation strategies within an established trend would always bear the risk of sudden changes in the direction of the price action.
Disclaimer: Your capital is at risk! Trading and investing on the financial markets carries a significant risk of loss. Each material, shown on this website, is provided for educational purposes only. A perfect, 100% accurate method of analysis does not exist. If you make a decision to trade or invest, based on the information from this website, you will be doing it at your own risk. Under no circumstances is Trendsharks responsible for any capital losses or damages you might suffer, while using the company’s products and services. For more information read our Terms & Conditions and Risk Disclaimer.


