The EURUSD is consolidating ahead of the March Non-Farm Payrolls in the U.S, similarly to the behaviour of the GBPUSD. Additionally, the pair's price action appears somewhat subdued today because of low trading activity (today is Good Friday, a major Holiday in Western Europe and the U.S.). Traders should keep in mind that low liquidity oftentimes leads to adverse fluctuations because of a lack of general direction in the market.
Even still, the publication of the unemployment data is likely to catalyse heightened price action when traders return. According to the preliminary market forecasts, the Bureau of Labour Statistics (BLS) is expected to post robust employment data for the previous month, which, in turn, should strengthen the dollar.
This presupposes the likely continuation of EURUSD's existing downtrend in the near future, driven by solid Non-Farm Payrolls data. Nevertheless, the EURUSD rebounded from a major Fibonacci Retracement level recently, which means that the accumulating bearish pressure is about to be checked. The end result is the creation of a bottleneck, which could see the price action break out in either direction. Even still, the prevailing fundamental outlook remains tilted to the downside.
1. Long-Term Outlook:
As can be seen on the daily chart below, the EURUSD continues to be establishing a massive Markdown, as postulated by the Wyckoff Cycle theory. This means that once the bearish trend is fully created, the underlying market sentiment is likely to transition into a new Accumulation range. This transition is typically encapsulated by heightened adverse fluctuations.
The aforementioned rebound occurred from the 38.2 per cent Fibonacci retracement level at 1.16937, which had previously served as a rough lower boundary of the last Re-Accumulation range. This represents the most substantial piece of evidence signifying the potential termination of the current Markdown. But there is more.
The Markdown itself appears to take the form of a major 1-5 impulse wave pattern, as postulated by the Elliott Wave Theory. Notice that the final impulse leg (4-5) seems to have been concluded just above the 38.2 per cent Fibonacci retracement, which further substantiates the expectations for the termination of the Markdown in the near future. This runs contrary to the underlying fundamental outlook.
The last several candles take the form of a Morning Star pattern, which also signifies the likely continuation of the currently emerging bullish correction. The correction could reach as high as 1.18450 before the broader bearish sentiment checks the short-term bullish bias. This level's significance stems from the fact that it served as a dip for the (2-3) impulse leg. Additionally, the level is about to converge with the 20-day MA (in red), which also serves as the middle line of the Bollinger Bands.
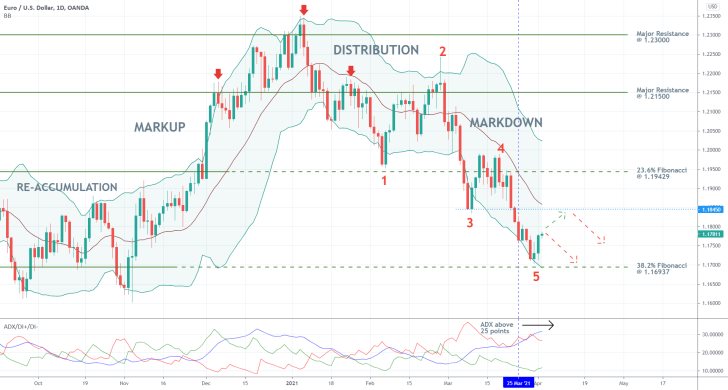
Overall, the broader outlook remains ostensibly bearish; however, short-term bullish pressure is mounting up. The price action is likely to fluctuate in a range between the 38.2 per cent Fibonacci retracement and the aforementioned resistance at 1.18450. It would take a decisive breakdown below the former to confirm the continuation of the existing downtrend or a decisive breakout above the latter to confirm its likely termination.
Notice that the ADX indicator has been threading above the 25-point benchmark since the 25th of March, which means that the market is indeed trending. The lagging factor should also be taken into consideration (the ADX registers changes in the market sentiment after some delay). This means that the Markdown is still relatively weak, but it has room to grow more solid.
2. Short-Term Outlook:
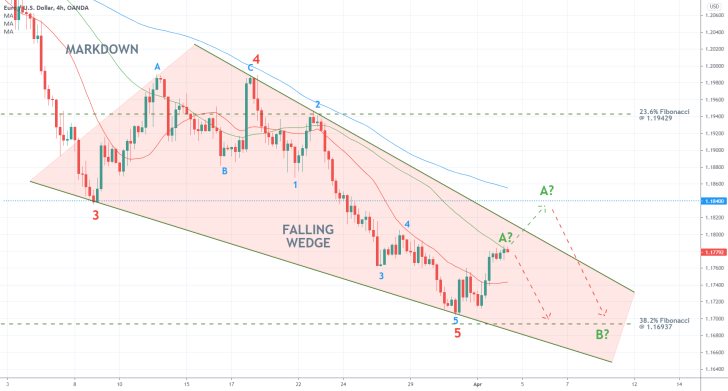
The possibility for future fluctuations within the above-mentioned range is examined in greater detail on the 4H chart below. The final retracement leg (3-4) and impulse leg (4-5) of the Elliott pattern takes the form of a Falling Wedge. Given that such 1-5 patterns are typically followed by an Elliott correction, such a possibility can be plotted on the chart. The price is initially set to reach a peak at point A before it drops down to B. The correction will then be completed at the subsequent peak at C.
Notice that at present, the price action is consolidating below the 50-day MA (in green), which acts as a floating resistance. This means that the peak at A may already have been reached at the current market price. Conversely, a rebound could also occur either from the upper boundary of the Wedge or the aforementioned resistance at 1.18450.
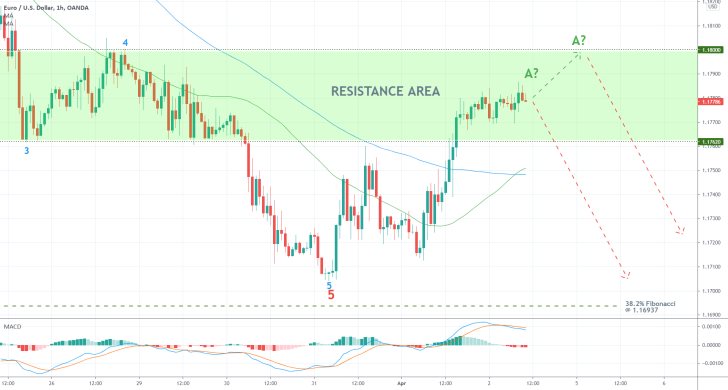
Based on the minor 1-5 pattern (in blue) comprising the final impulse leg (4-5) of the broader Elliott pattern (in red), a Resistance Area (in green) is drawn on the hourly chart below. Even though the price action is currently consolidating between the two boundaries of the Area (the minor support at 1.17620 and the psychological resistance at 1.18000), any breakout/down away from the Area would illustrate the next most likely direction for the EURUSD.
The 50-day MA (in green) crossed above the 100-day MA (in blue), which represents a bullish signal. However, the MACD indicator has already registered a bearish crossover, which means that the underlying momentum is likely to become increasingly more bearish.
3. Concluding Remarks:
The underlying setup seems more suitable for market bears. They should wait for the current bullish correction to peak at one of the aforementioned levels before they, utilising trend-continuation strategies, sell at the resulting peak. The first target level is encapsulated by the 38.2 per cent Fibonacci retracement level at 1.16937.
All Indicators on the EURUSD Point to the Same Likely Direction
The EURUSD has been demonstrating strength over the past several days as bulls retain control in the short term. Part of the reason for the persistence of this bullish correction in an otherwise bearish market stems from the relatively uneventful present week. Many markets were closed on Monday due to a Bank Holiday, which led to low trading activity and diminished overall liquidity. This trend was then carried into the next trading session due to the lack of any major economic drivers to stir higher volatility, apart from the recent IMF meetings.
This subdued price action environment represents ideal conditions for the development of a correction in an established trend, which, in turn, can be used by traders looking to join the trend. In other words, traders can expect another directional price swing on the EURUSD as soon as the general trading activity returns to normal.
Given the relatively subdued nature of the existing market sentiment coupled with the current technical outlook on the EURUSD, the price of the pair is likely to change its underlying direction shortly. This enables bears to utilise trend continuation strategies at the resulting swing peak by selling the underlying.
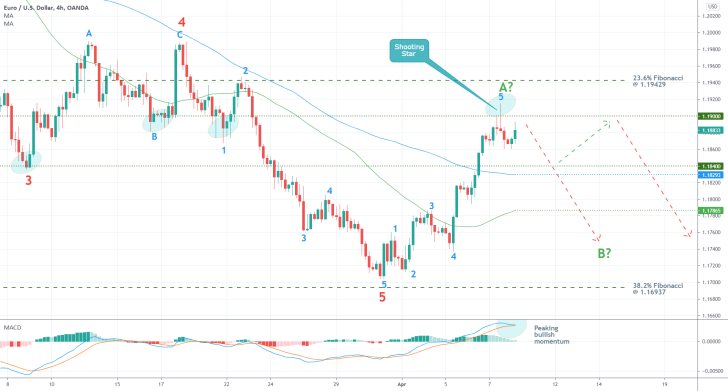
As can be seen on the 4H chart above, the price action is currently concentrated between the major support level at 1.18400 and the psychological resistance at 1.19000. The prominence of the former was already confirmed once (served as a dip at point 3), whereas the prominence of the latter has been confirmed twice (also highlighted with blue ellipses). In short, this is the range within which the price action is expected to reverse directions.
Notice that one of the latest candles represents a Shooting Star (typically taken as an indication of rising bearish bias), which closed below the 1.19000 resistance. This serves as further confirmation of the broader bearish expectations.
As was argued in the latest journal entry, the current bullish correction represents a 1-5 impulse wave pattern, as postulated by the Elliott Wave Theory. It appears to be concluded, which means that the price action has already likely peaked at point A. This means that the EURUSD is now ready to resume establishing the ABC Elliott correction.
All of these indicators, including the MACD tool, imply the likely continuation of the previous downtrend. While the price action is likely to once again head towards the 38.2 per cent Fibonacci retracement level at 1.16937 in the near future, bears should watch for the behaviour of the price action around the remaining supports. These are underpinned by the two moving averages - the 50-day MA (in green) and the 100-day MA (in blue).
The EURUSD is Due for a Bearish Correction
The EURUSD shot more than 0.30 per cent yesterday following the better-than-expected U.S. consumer price data for March. The dollar weakness that was prompted by the inflation report is counterintuitive to common logic, which underpins the speculative nature of the latest EURUSD upswing. Given this massive volatility in the market, the expectations for an immediate correction gain some prominence.
The market appears to have already priced in the news from yesterday, which raises the likelihood of an imminent bearish correction.
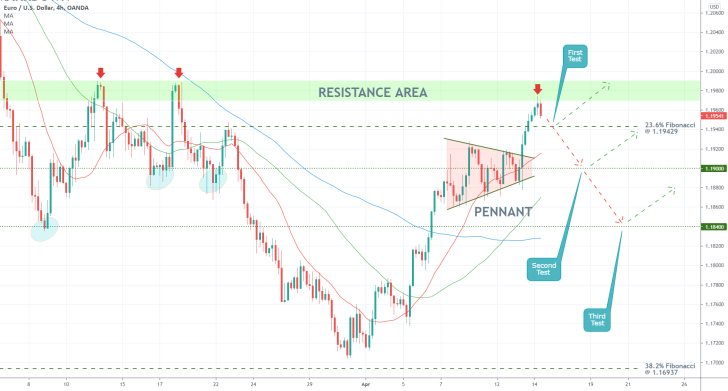
As can be seen on the 4H chart above, the price of the EURUSD pair has peaked just below the lower boundary of the major Resistance Area (in green). The latter is of crucial significance because it underscores the previous swing high. In other words, the likelihood of a bearish correction is increased the closer that the price gets to the last swing peak.
The first target for such a correction is encapsulated by the 23.6 per cent Fibonacci retracement level at 1.19429. The latter bears significant psychological importance, which is why it could turn into a major make-it-or-break-it point for the bears. Unless the price manages to break down below it, the bulls would be expecting another rebound from 1.19429, entailing an opportunity to join the existing uptrend.
If the price manages to penetrate below the 23.6 per cent Fibonacci retracement, the next goal would likely be the 1.19000 support. The significance of the latter has already been tested on two separate occasions. The deepest target for a more sizable bearish correction is encompassed by the 1.18400 support, which served as a previous swing low.
The 1.19000 support is about to converge with the 50-day MA (in green), whereas the 1.18400 support is about to do the same with the 100-day MA (in blue). This raises the importance of the two.
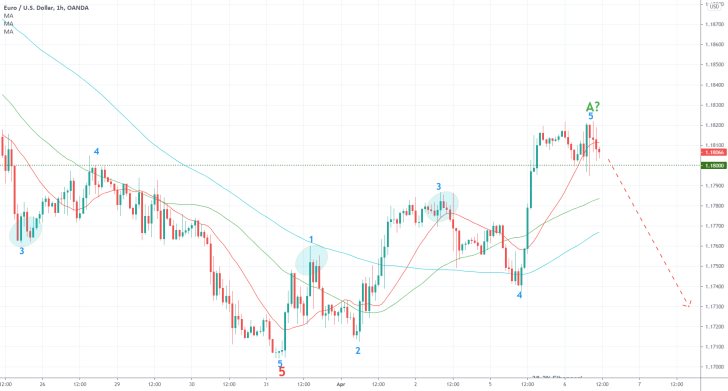
- The initial analysis projected the likely emergence of the first impulse leg (5-A) of a new Elliott Correction (ABC) shortly after its publication. These forecasts now appear to be more or less confirmed, albeit not exactly where it was expected (the price broke out above 1.18000).
- Nevertheless, the impulse leg does indeed seem to be completed, taking the form of a minor 1-5 impulse wave pattern itself. That is why the price is now more than likely to reverse its direction yet again.
- The first target for this renewed bearish downtrend is the same as the one suggested in the analysis. Bears should be careful with the 100-day MA (in blue) and the 50-day MA (in green), as the two moving average continue to serve the role of floating resistances.
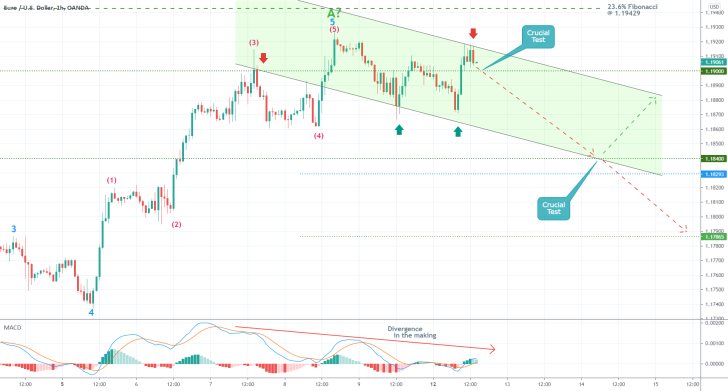
- While the EURUSD is taking its time to start depreciating, which is what the primary analysis and the last follow-up expect, bearish pressure keeps mounting. A 1-5 impulse wave pattern (in purple) was completed below the 23.6 per cent Fibonacci retracement level at 1.19429, and the price remains consolidating below it.
- A new descending channel has emerged, which encapsulates the transition of the underlying market sentiment into a new downtrend. The MACD indicator, which is currently demonstrating a Divergence in the making, substantiates these bearish expectations.
- The 1.19000 and 1.18400 support levels encapsulate the most significant obstacles for the newly forming downtrend. Bearish pressure is likely to rise tomorrow on the U.S. inflation data.
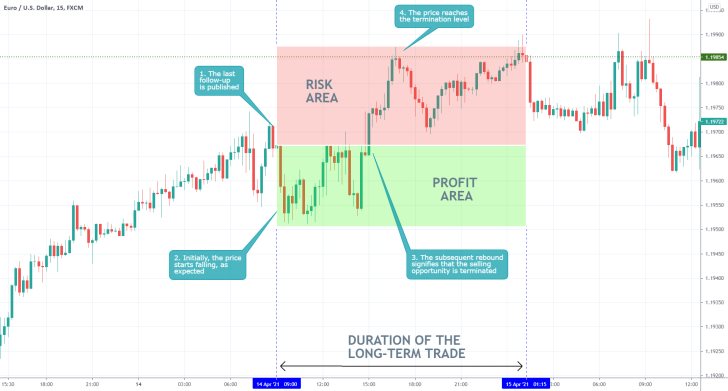
- Despite the marginal success of the last follow-up, the EURUSD analysis as a whole was a complete failure. This was owing mostly to the fact that it underestimated the dollar weakness at the time it was published.
- Sometimes it is impossible to perceive the changing market sentiment as it evolves, which is why it is so vitally important to keep tight stop-loss levels. Remember, regardless of whether you manage to predict the ultimate direction of the market or not, the final market sentiment would very rarely be the same as the one you observed before placing the trade.
- Hence, the role of any good risk management is as much to protect you against unforeseen threats as it is to hedge the risk of the threats that were observed at the time of your analysis.
Disclaimer: Your capital is at risk! Trading and investing on the financial markets carries a significant risk of loss. Each material, shown on this website, is provided for educational purposes only. A perfect, 100% accurate method of analysis does not exist. If you make a decision to trade or invest, based on the information from this website, you will be doing it at your own risk. Under no circumstances is Trendsharks responsible for any capital losses or damages you might suffer, while using the company’s products and services. For more information read our Terms & Conditions and Risk Disclaimer.


