Expect mass-market psychology to become the determining factor during today's trading session with regards to the direction of EURUSD's price action. The pair has developed a massive bullish run over the past several weeks, which was prompted mainly by the monumental deal for financial support for struggling European economies, that was recently struck by EU ministers in Brussels.
Most traders like to think that 'what goes up, must come down', which belief is fuelled by the most basic assumptions of the psychology of trading. Essentially, every new peak in EURUSD's uptrend is seen as a potential turning point, which excites traders because of the potential profits that could be made from 'selling the peak'.
Yet, such basic assumptions are especially dangerous because the so-called market whales tend to exploit similar beliefs that are shared by the majority of traders. The whales have large accounts, which grants them certain market power. They can use this power to influence the direction of a particular asset's price action.
The whales exploit the fallacies of mass-market psychology by trading against the direction that is expected by most retail traders with smaller account balances. Essentially, when most traders are buying or selling (especially around a significant support or resistance level), the whales do the opposite.
They can anticipate that many stop losses are going to be placed around such psychological price levels. The whales attempt to drive the price action up or down so that those stop losses can be triggered. This, in turn, creates temporary discrepancies in the underlying buying and selling pressures. The market whales can then go in the generally accepted direction, only after they have collected their profits from the initial adverse spike.
All of this should be considered because the pivotal meeting of the FOMC later today is hoped by many to strengthen the struggling dollar. Thus, many traders are likely to expect the meeting to catalyse a long-anticipated correction in EURUSD's price action.
While many indications are confirming these assertions, traders should remain vigilant and prepare for sudden and seemingly random fluctuations before and after the publication of FOMC's decision. Essentially, the current environment encompasses everything that the market whales might be looking for, and psychology more than anything else is likely to drive the price action.
1. Long-Term Outlook:
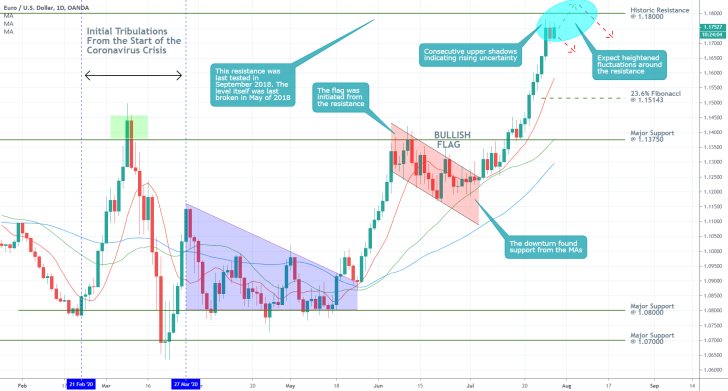
As can be seen on the daily chart below, the EURUSD is currently trading quite close to a significant resistance level, which has remained unbroken for nearly two years. Given the prevailing expectations for a minor bearish correction, many stop losses of short orders anticipating the release of FED's data can be expected to be placed around this resistance level at 1.18000. The level itself seems like the perfect turning point, which is why traders should prepare for momentary spikes to and above it.
Such adverse spikes could occur around the time of publication of FED's decision; however, they are not likely to last for long. After the market starts pricing in the final decision, the underlying adverse volatility is expected to be scaled back.
Based on the shape and size of the bullish flag presented below, the longer-term projections encompass a likely reversal from the historic resistance (only AFTER the initial sporadic fluctuations start to wane). Such behaviour would resemble the bullish flag pattern closely, in that it was also initiated around a major resistance level.

The correction could reach the 10-day MA (in red) or the 30-day MA (in green), which serve as floating supports before the bulls can regain control. This assertion is once again based on the observed behaviour of the price action from when the flag pattern was developed. Depending on just how much bearish bias gets accumulated over the next few days, a potential correction could even reach the 23.6 per cent Fibonacci retracement level at 1.15143, which remains the closest fixed support level.
2. Short-Term Outlook:
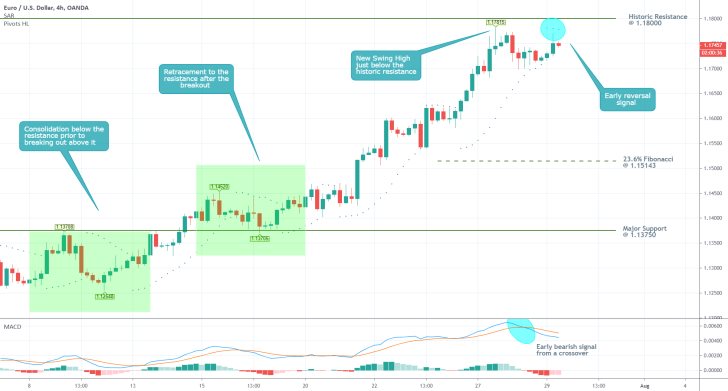
As can be seen on the 4H chart below, the EURUSD established a new swing high just 20 pips away from the historic resistance level at 1.18000. This behaviour is demonstrative of potential consolidation below the resistance, similar to what happened before the price action broke out above 1.13750.
These expectations are supported by the Parabolic SAR indicator, which provides an early signal of a likely trend reversal. The MACD has also recently concluded a bearish crossover, which can be perceived as a confirmation of rising bearish momentum.
Finally, the underlying price action hasn't established a swing low since the immediate retracement to the major resistance (currently support) level at 1.13750, following the aforementioned breakout. This is what gives credence to the popular belief that a bearish correction is overdue, but it is also what bolsters the likelihood for adverse trading on the part of market whales.

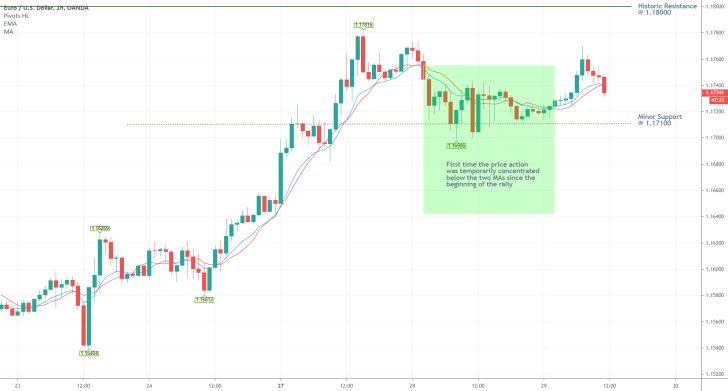
The hourly chart below encompasses the first noteworthy attempt for the formation of a minor bearish correction (the area in green). The price action established a minor swing low just below the support at 1.17100.
More importantly, though, it exhibited an early attempt for trading below the 10-day EMA (in blue), which fell below the 10-day MA (in red) for a little while. This is an essential condition for any trend reversal and the subsequent establishment of a sizable correction.
For the time being, however, the EURUSD continues to be consolidating between the historic resistance at 1.18000 and the minor support level at 1.17100. This behaviour is demonstrative of waning bullish bias and could be an early precursor to a subsequent reversal.

3. Concluding Remarks:
Today's analysis highlights the associated risks of trading the FOMC decision. Chiefly, risk-averse traders should be cautious of adverse fluctuations around the time of its publication. Moreover, the underlying conditions are perfect for the market whales to practice their opposing trading, which increases this associated risk for retail traders.
The longer-term factors are indeed favourable for the establishment of a minor correction, which should not be mistaken for a complete trend reversal. Accordingly, traders should also consider the possibility of a disappointing FED meeting, in the sense that the dollar might not receive the necessary support it needs from the FOMC in order to recuperate its recent losses.
The current market environment seems quite volatile and unpredictable, so traders might want to wait and see how the market discounts today's events before they open any orders. At present, there are too many unknowns, which weighs down on the potential risk/reward ratio of trading prior to the release.

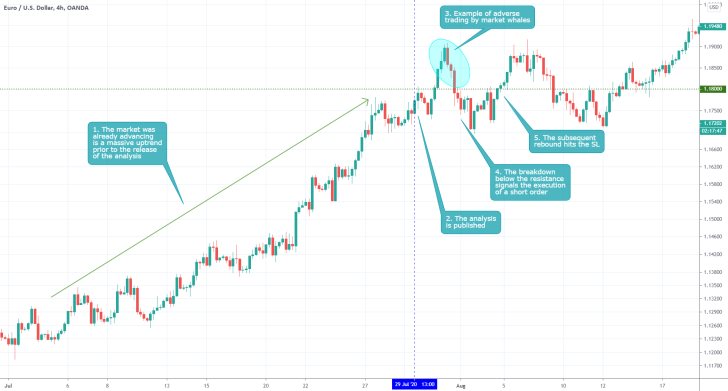
- he longer-term projections of the analysis were semi-accurate in that the bullish trend was indeed terminated around the resistance at 1.18000, but a sizable bearish correction did not emerge from that same level. The best aspect of the analysis was its recognition of the dangers from adverse trading on the part of market whales around crucial price levels – market participants with massive trading accounts. Market whales typically trade against the generally anticipated direction of the market, in order to target the SLs of retail traders with smaller accounts.
- Additionally, the analysis recognised the massive uncertainty in the market around the time of publication, which is why it cautioned against the execution of spot orders. This was the other strong aspect of the analysis.
Disclaimer: Your capital is at risk! Trading and investing on the financial markets carries a significant risk of loss. Each material, shown on this website, is provided for educational purposes only. A perfect, 100% accurate method of analysis does not exist. If you make a decision to trade or invest, based on the information from this website, you will be doing it at your own risk. Under no circumstances is Trendsharks responsible for any capital losses or damages you might suffer, while using the company’s products and services. For more information read our Terms & Conditions and Risk Disclaimer.


