A bullish reversal on the EURUSD appears to be completed now because of the recent woes for the greenback. With the changing market sentiment on the pair, bulls can now look for a chance to utilise trend continuation strategies on the newly emerging uptrend.
Two leading factors are causing the dollar to tumble in the short term. Amazon's disappointing earnings numbers for the second quarter have prompted an immediate selloff in the stock market as global demand for U.S. stocks eases. The fallout is impeding the demand for the greenback as well.
Additionally, the pace of economic growth in the U.S. missed by 2 per cent the consensus forecasts, which underpins massive discrepancies between the expectations for economic recovery and reality. This, too, contributes to the short term selloff of the greenback.
Not even Jerome Powell was able to help the reeling currency on Wednesday, as the FOMC did not bring anything new to the table in terms of monetary policy changes.
Meanwhile, the pandemic situation in Europe is improving, which is allowing investors' enthusiasm to improve. This is having a positive effect on the euro, which is once again advancing.
The price action is entering a new Fibonacci distribution area
As can be seen on the daily chart below, the price action has been behaving as per the expectations of the Elliott Wave Theory over the last several months. Chiefly, each uptrend and downtrend takes the form of a distinct 1-5 impulse wave pattern.
It remains to be seen whether the latest upswing would turn into a massive uptrend, or it would amount to nothing more than a temporary retracement leg (3-4) of a broader downtrend. It should be mentioned that the price action has been advancing over the last six consecutive days on heightened optimism, which is more likely to be demonstrative of the latter case.
Moreover, with each passing day after the seventh day of consecutive gains, the likelihood of a bearish correction starts to increase exponentially. Hence, despite the definite signs of strong buying pressure in the market, bulls should not take the behaviour of the price action over the last several days as a definite confirmation of the emergence of a new bullish uptrend.
At present, the price action is contained within the 23.6 per cent Fibonacci retracement level at 1.18727 and the 38.2 per cent Fibonacci at 1.19473. Due to the significance of these two crucial thresholds, the price action is likely to bounce up and down between them in the near future.
On the one hand, the snap rebound above the 20-day MA (in red), leaving in its wake a distinctive Hammer Candle, signifies the strength of the 23.6 per cent Fibonacci. Bulls can therefore take advantage of any potential dropdowns to it as an opportunity to go long at a discount.
On the other hand, the recent crossover of the 50-day MA (in green) below the 100-day MA (in blue), coupled with the fact that the two are drawing near to the 38.2 per cent Fibonacci, underpins the strong bearish pressure that can be found at 1.19473. Bears can look for an opportunity to utilise contrarian trading strategies there.
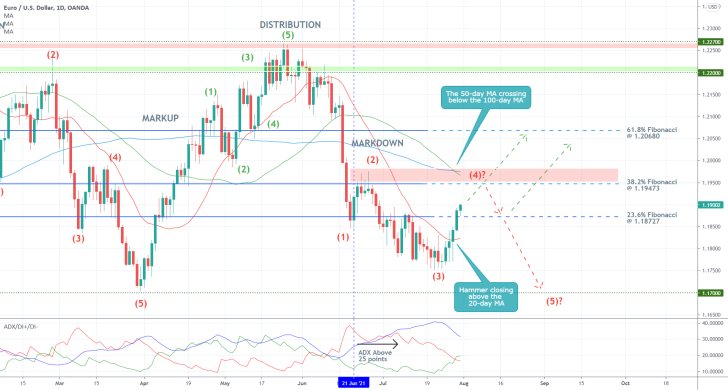
The ADX indicator has been threading above the 25-point mark since the 21st of June, which means that technically the bearish downtrend is still active. Hence, a potential reversal from the 38.2 per cent Fibonacci would potentially clear the way for another dropdown towards the last swing low at 1.17000. This would represent the completion of the final impulse leg (4-5).
The structure of the current upswing
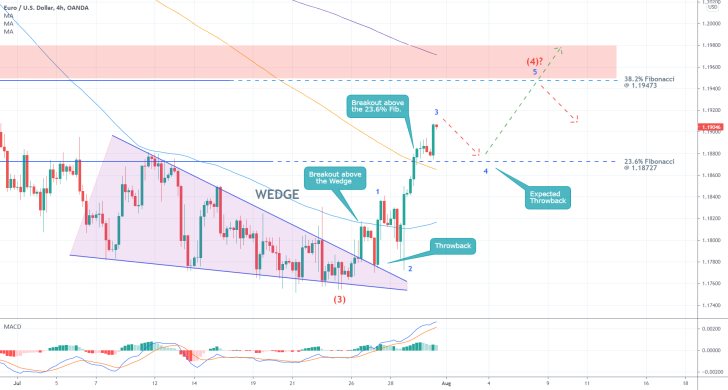
The last upswing commenced following the breakout above the Descending Wedge pattern, as shown on the 4H chart below, which was forecasted by our last analysis of the pair. At present, the aforementioned (3-4) retracement leg appears to be taking the form of a minor 1-5 bullish impulse wave pattern itself.
Knowing this, bulls and bears can take advantage of the underlying setup in two distinct ways. Bulls can wait for another throwback to the 23.6 per cent Fibonacci, which is currently converging with the 200-day MA (in orange). They would be eyeing a subsequent rebound towards the 38.2 per cent Fibonacci.
Bears, in contrast, should wait for the price action to reach 1.19473 before they place any short orders. The implementation of contrarian trading strategies there would be further substantiated by the fact that the 300-day MA (in purple), which serves the role of a floating resistance, is drawing near to the 38.2 per cent Fibonacci.
The expectations for the extension of the upswing towards 1.19473, which is positioned just 50 pips away from the massively important psychological threshold at 1.20000, are supported by the current reading of the MACD indicator. The underlying bullish momentum remains quite solid.
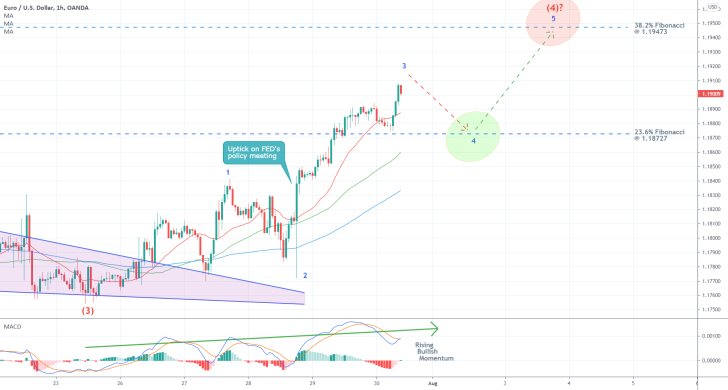
The hourly chart below elucidates the two trading opportunities in greater detail. As shown, the 50-day MA and the 100-day MA are both converging towards the 23.6 per cent Fibonacci level, which confirms its likely role as the dip of a forthcoming minor pullback. That is what bulls would be looking for.
Moreover, the underlying bullish momentum looks poised to continue appreciating in the near future, as demonstrated by the MACD. So far, each new wave on the histogram correlates to a peak that exceeds the previous peak on the price action. This also substantiates the expectations for an upswing towards the 38.2 per cent Fibonacci.
Concluding Remarks
Bulls looking to buy near 1.18727 and bears looking to sell near 1.19473 should both place stop-loss orders that are not more than 30 pips away from their initial entries.
In the case of the former, they can substitute their fixed stop orders for floating TPs once the price action comes within 50 pips away from the 38.2 per cent Fibonacci retracement level. The latter can do the same once the price action comes close to the 23.6 per cent Fibonacci.
Another False Movement on EURUSD, as the Price Consolidates
The price of EURUSD remains consolidating around the 23.6 per cent Fibonacci retracement level at 1.18727, as the underlying market sentiment, for the most part, remains neutral. Given this range-trading behaviour of the price action, several false movements developed recently.
Even though the market is not going in either direction presently, these false movements could indicate the changing demand pressures between the euro and the dollar.
The dollar advanced marginally on the expectations for solid employment numbers, which are scheduled for publication on Friday. Additionally, the greenback is being supported as the market prices in the latest inflation developments.
Despite these factors that favour the dollar strengthening in the near term, the euro should not be dismissed lightly. Factory activity in the Eurozone, particularly employment in the sector, has reached record-breaking levels in July.
Overall, the EURUSD is likely to continue appreciating towards the next major resistance level before a more decisive bearish reversal could take place.
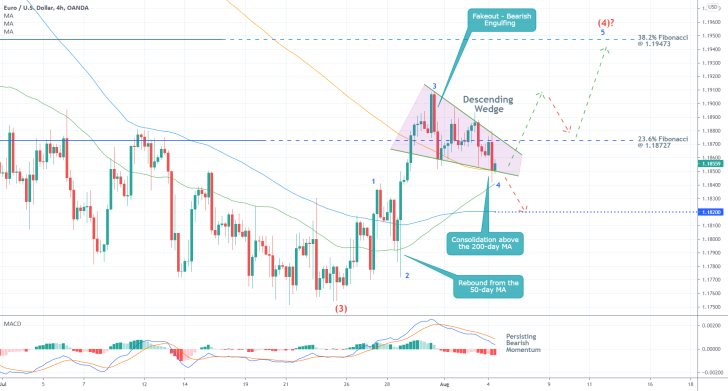
As can be seen on the 4H chart above, the aforementioned consolidation around 1.18727 appears to be taking the form of a Descending Wedge. This is a type of pattern that typically entails likely bullish rebounds.
In the context of the latest behaviour of the price action, the emergence of such a Wedge could be interpreted as yet another false movement. This is owing to the low levels of market liquidity at present. That is why bears should not rush to sell around the current spot price.
Notice that the 50-day MA (in green) is currently closing in on the lower limit of the Wedge, which is presently converging with the 200-day MA (in orange). The accumulation of the two moving averages is demonstrative of the existence of solid support just below the range.
However, bulls should not overlook the fact that the underlying momentum in the short term remains prevailingly bearish. The MACD indicator underpins this.
Even still, they could utilise a potential breakout above the Wedge as an indication that the EURUSD is ready to resume climbing further north. More risk-averse bulls could look for an opportunity to go long once the price breaks out above the 23.6 per cent Fibonacci decisively.
Less risk-averse bulls, in contrast, could look for a chance to go long around the current spot price. They could place a stop-loss order just below the 100-day MA (in blue), at 1.18200. This is less than 30 pips away from the current spot price, so that the risk would be justified.
The goal for both is underpinned by the 38.2 per cent Fibonacci retracement level at 1.19473.
EURUSD at a 5-Month Low. Is There an Upcoming Reversal in Sight?
Earlier today, the price of the EURUSD sunk temporarily to 1.17450, which was last reached in April. Bearish pressure on the pair keeps rising following the massively robust employment data in the U.S. for July.
The greenback is currently strengthening on the expectations of traders and investors alike for a possible FED tapering of the asset purchases sooner than initially suggested. This is owing to the fact that the U.S. rate of economic growth is accelerating.
This trend is likely to be bolstered on Wednesday when the U.S. Bureau of Labour Statistics (BLS) is scheduled to post the latest inflation numbers for the same period. The consensus forecasts expect inflation to drop by 0.5 per cent in July, which would meet FED's longer-term projections.
Despite these developments, there are also some reasons to anticipate a possible minor bullish pullback on the EURUSD in the short term, as the price action probes the aforementioned support level with historical significance.
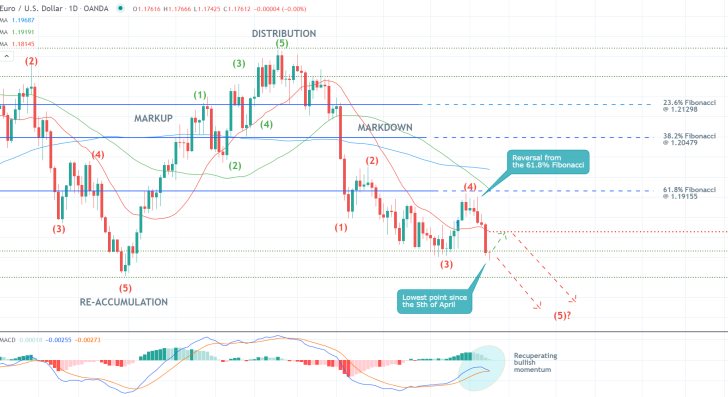
As can be seen on the daily chart above, Friday's non-farm payrolls exacerbated EURUSD's tumble. The price action broke down below the 20-day MA (in red), which serves as a floating support, and closed just below the previous swing low at 1.17660.
The price action has been unable to break down below it since mid-July, despite having probed the support on multiple occasions. This gives credence to the expectations for a likely bullish pullback from the current spot price.
This is further supported by the fact that the underlying bullish momentum is currently rising, as demonstrated by the MACD indicator. Yet, bulls should not overlook the fact that the prevailing market sentiment remains ostensibly bearish.
This can be inferred by the fact that the latest downtrend takes the form of a bearish 1-5 impulse wave pattern, as postulated by the Elliott Wave Theory. Notice that the second retracement leg (3-4) peaked just below the 61.8 per cent Fibonacci retracement level (the last Fibonacci threshold) at 1.19155.
That is why the price action is now likely to proceed with the development of the last impulse leg (4-5) towards the lower boundary of the previous Re-Accumulation range at 1.17000. The latter also bears psychological importance.
Even still, bears should not go short at the current spot price in an established downtrend. Instead, they should wait for the next pullback to peak before they sell the EURUSD.
Bulls, in contrast, could go long around the current spot price, but they need to place a stop-loss that is no more than 40 pips away from the initial entry-level. Their target is the minor resistance level at 1.18140, underpinned by the 20-day MA (in red).
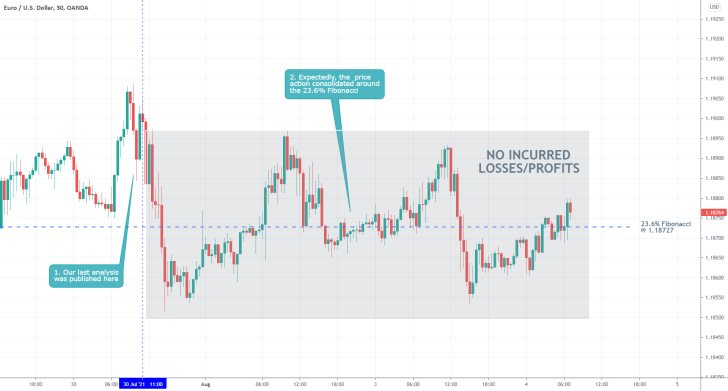
- Our last trade on the EURUSD is so far coming to no avail. Shortly after the publication of our last EURUSD analysis, the price action started consolidating around the 23.6 per cent Fibonacci retracement level at 1.18727, as expected.
- However, no big price swing was established in either direction afterwards. Instead, the price action went on to continue range trading.
- Ultimately, no losses were incurred but no profits were generated either.
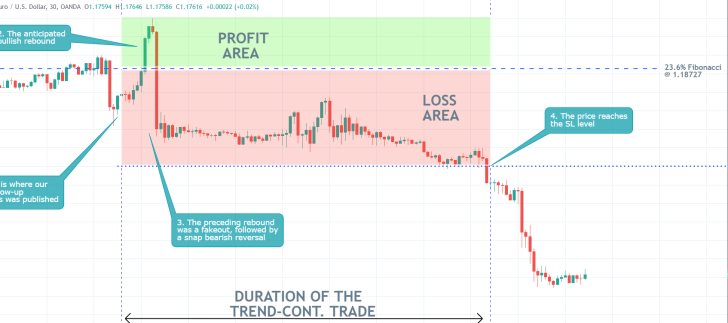
- Our last follow-up analysis of the EURUSD anticipated a bullish rebound from the bottom boundary of the Descending Wedge pattern. At first, the breakout above the 23.6 per cent Fibonacci retracement level at 1.18727 seemed like it could be it.
- However, the immediate bearish reversal proved it to be nothing more than a fakeout.
- The above setup is a good reminder that you cannot win them all, which is why having a consistent risk management strategy can save you a lot of pains on the market.
- As shown, the price went on to depreciate a lot more, but the tight SL prevented such massive losses.
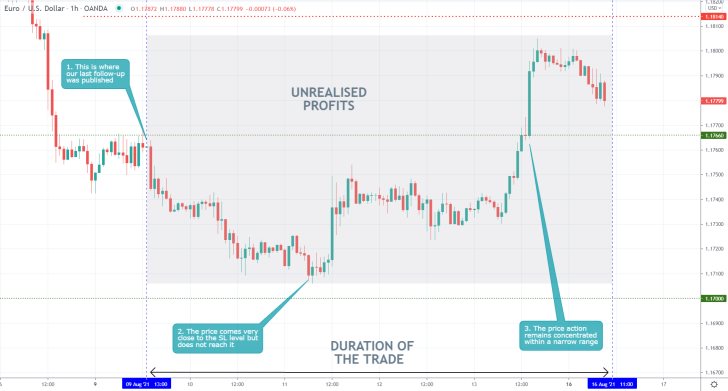
- Our last follow-up analysis of the EURUSD ultimately came to no avail. It did not generate any profits, but it did not incur any losses either. However, the price action came very close to hitting the SL (40 pips away from the initial entry).
- There is not much that could be said in this case. On some rare occasions, traders might have to wait for their trade to develop without generating any sizable results. This could be exhausting and put extra pressure on them.
- That is why traders need to have mental stamina and be prepared for times when the market does not go in either direction.
Disclaimer: Your capital is at risk! Trading and investing on the financial markets carries a significant risk of loss. Each material, shown on this website, is provided for educational purposes only. A perfect, 100% accurate method of analysis does not exist. If you make a decision to trade or invest, based on the information from this website, you will be doing it at your own risk. Under no circumstances is Trendsharks responsible for any capital losses or damages you might suffer, while using the company’s products and services. For more information read our Terms & Conditions and Risk Disclaimer.


