Whenever the market is advancing towards historic heights or plummeting near record depths, traders' opinions tend to be really polarised - some expect to see the trend continuing to break records while others anticipate an immediate reversal. It is usually the case with trading that one of those two groups is right. But why is this common knowledge worth mentioning at all?
The EURUSD is not trading near such historic peaks and valleys at the present moment; however, the pair is consolidating just below a major resistance level that has been prevalent for nearly three years. Given the massively undervalued U.S. dollar, traders have started to weigh in on just how far the pair can go. As opinions become increasingly more skewed, so is the underlying volatility likely to increase. This, in turn, is going to affect the pair's price action greatly.
On the one hand, the reeling dollar woes continue to be exacerbated by vaccine optimism, as global demand moves away from lower-risk securities. This is the primary reason for the strong bullish commitment of the EURUSD in the short-term.
On the other hand, there are no reasons to expect that the greenback's freefall will continue indefinitely. Manufacturing PMI, Services PMI, and unemployment rate data are scheduled for publication later this week, which is likely to affect the value of the dollar. Moreover, expectations for another robust earnings season, which is due in two weeks, is expected to help the greenback recuperate.
Given that the EURUSD currently finds itself at such a crucial junction and market opinions are becoming increasingly polarised, it seems like the perfect time to evaluate the two potential scenarios - continued price appreciation or upcoming trend reversal.
1. Long-Term Outlook:
Utilising the Wyckoff Cycle theory is a good way of examining any given trend's different developmental stages. As shown on the daily chart below, the current uptrend, which began developing in late-May, has already established two Markups separated by an intermediate Re-Accumulation range.
This presupposes the emergence of an eventual Distribution range prior to the creation of a new Markdown. Of course, this assertion should not be perceived as a suggestion for an immediate trend reversal, as the price action could trade higher before reverting its direction.
Notice that the price action has been consolidating just below the historic resistance level at 1.23000 for the past several days. This psychological barrier was last broken in April 2018, which underpins its significance. In other words, a decisive breakout above this threshold would signify the continued strength of the uptrend. In contrast, a sizable reversal from it would manifest the likely emergence of a new downtrend.
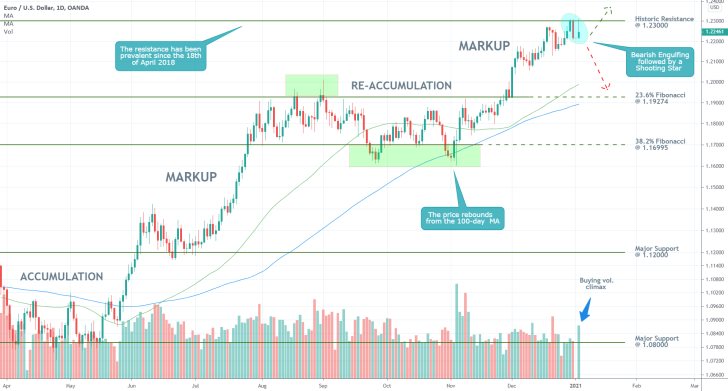
There is mounting evidence suggesting that the price action might be due to establishing at least a sizable bearish correction, if not a full-fledged trend-reversal. Yesterday's trading session resulted in an upsurge of buying volume, which did not correspond to a major breakout. Consequently, yesterday's candle took the form of a Shooting Star, following the preceding Bearish Engulfing. All of these factors are suggestive of mounting bearish bias, which could lead to a trend reversal.
The price action is likely to depreciate to the 23.6 per cent Fibonacci retracement level at 1.19274. The level, which previously served the role of a prominent resistance, currently represents the nearest psychological support. Notice also that the 100-day MA (in blue) and the 50-day MA (in green) are both currently converging towards this Fibonacci level, making it an even more substantial support. If a bearish reversal does develop next, it will have a difficult time ahead in breaking below these three converging supports.
2. Short-Term Outlook:
As can be seen on the 4H chart below, the latest price action has been advancing within the boundaries of an ascending channel. At present, it is consolidating above the lower boundary of the channel and below the historic resistance at 1.23000. This behaviour entails the likely upsurge in volatility, which is inlined with the aforementioned expectations.
In relation to the above-mentioned assertion that eventually the current Markup is going to transition into a new Distribution, it can be observed that the major support level at 1.21700 seems like a suitable contender for being the lower boundary of such a range. In other words, the price action could consolidate between 1.23000 and 1.21700 in the near future before a new Markdown emerges. That is if the development of the current Markup is not continued.
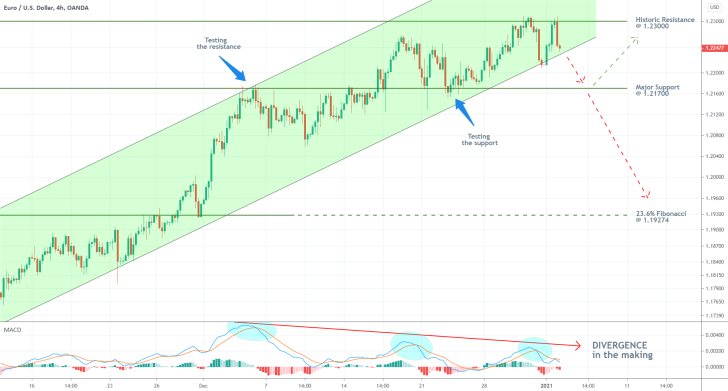
The MACD indicator underpins a divergence in the making - the underlying bullish momentum is gradually waning while the price action fails to establish higher peaks. This behaviour is suitable for the establishment of a new trend reversal. As stated earlier, the first major goal for such a Markdown is encompassed by the 23.6 per cent Fibonacci retracement level at 1.19274.
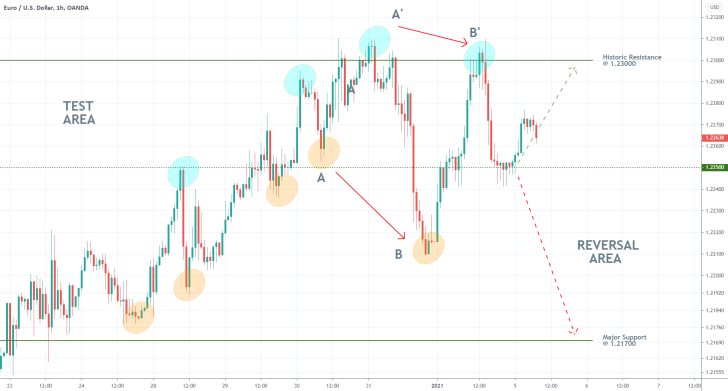
This process of changing EURUSD's underlying direction may have already started. As can be seen on the hourly chart below, the price action has already established a lower peak (point B') and lower dip (point B). Such behaviour is synonymous with transitioning market sentiment.
The price action rebounded from the support at 1.22500 and is currently headed towards the historic resistance once again. This range is labelled "Test Area" - this is where the market bears should look for an opportunity to place their short orders. An eventual failure of the price action to break out above the two previous peaks (at A' and B') could signal this. In other words, they can look for an opportunity to enter short, provided that the next peak is lower than the preceding two highs.
3. Concluding Remarks:
Contrarian trading strategies can be utilised, provided that the current markup is not extended past the historic resistance level at 1.23000. This, however, will entail a comparatively high degree of risk. More risk-averse traders can instead wait for the price action to break down within the Reversal Area, where they can wait for an opportunity to place trend-continuation trading strategies (in relation to a newly emerging downtrend).
Dead Cat Bounce Indicates the EURUSD is Ready to Resume Falling
All of the stars seem to be aligning for the EURUSD to continue falling, as was forecasted in our initial analysis. As regards the current fundamental factors, there really doesn`t seem to be anything to jolt the underlying dynamic of the pair's price action.
There aren`t any major economic releases in Europe scheduled for this week, which means that there is no incoming data to reinvigorate the euro. Meanwhile, vaccination in the bloc continues to be carried out on a somewhat subdued pace as Governments struggle to regain back control in the fight against the pandemic. All of this entails further struggles for the single currency down the line.
In contrast, the situation for the greenback is at the polar opposite. The ongoing impeachment of President Donald Trump boosted volatility today in the wake of the recent tribulations in Washington. Meanwhile, the positive inflation data from earlier today cushioned the greenback's pains to a degree.
The expectations for a robust earnings season, which is effectively starting from tomorrow, are likely further to boost the global demand for the U.S. dollar. Hence, there are plenty of reasons to expect the EURUSD to continue tanking in the upcoming days.
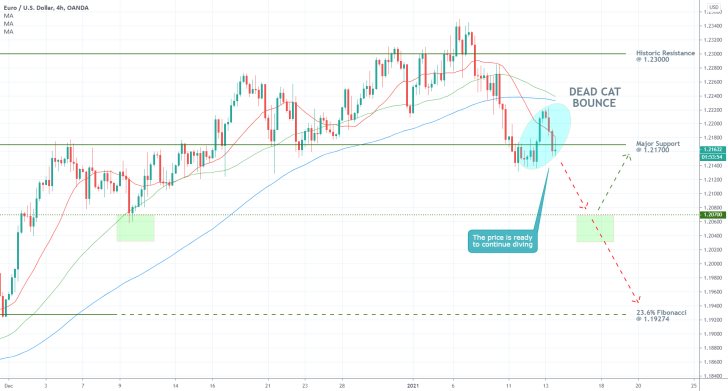
As can be seen on the 4H chart above, the price action just finished establishing a Dead Cat Bounce pattern, which is a major indication that the downtrend is likely to continue. What is even more important is that the pair's price is currently concentrated below the major support level at 1.21700, which is a prerequisite for this to happen.
Notice that the Dead Cat Bounce peaked just below the 100-day MA (in blue), which implies that the momentary surge in bullish bias is negated by the stronger bearish sentiment in the market. In other words, now that the interim bullish correction is over, the downtrend is ready to resume developing.
Speaking of moving averages, if the 50-day MA (in green) manages to penetrate below the 100-day MA, the two of them in conjunction with the 20-day MA (in red) will adopt a perfect descending order - the price action being concentrated below the 20-day MA, below the 50-day MA, below the 100-day MA. Such a relationship would represent yet another piece of evidence confirming the strength of the bearish bias in the market.
The next target for the resumed downtrend's development will be the major support level at 1.20700, due to the latter's previous role as a dip in the preceding uptrend. While this level could prompt another bullish correction, a breakdown below it would clear the way for the price action to head towards the psychologically significant 23.6 per cent Fibonacci retracement level at 1.19274.
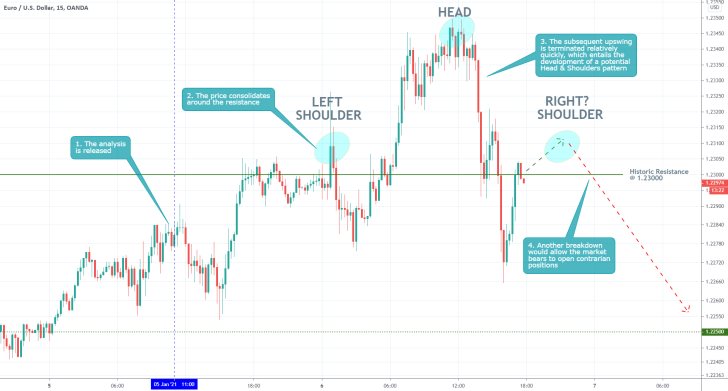
- Despite bigger-than-expected fluctuations above the historic resistance at 1.23000, the price action is once again on track to completing the anticipated trend-reversal. This can take the form of a Head and Shoulders pattern, in which case the bears need to observe how the price behaves around the resistance, next. H&S represents one of the most popular bearish-reversal patterns, which could be used to pinpoint a suitable entry into a new short order.
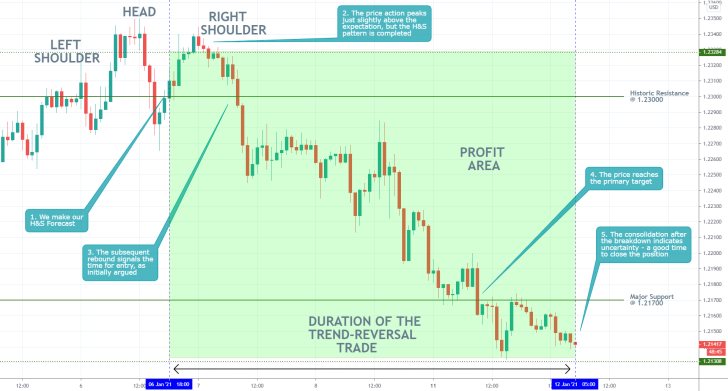
- The success of the trade is owing to the correct and timely reading of the emerging Head and Shoulders Pattern by the previous journal entry. It allowed for precise contrarian trading.
- The above setup underpins the importance of recognising such prominent patterns at crucial times - e.g. spotting a H&S pattern emerging near a historic resistance level increases the likelihood of a trend reversal.
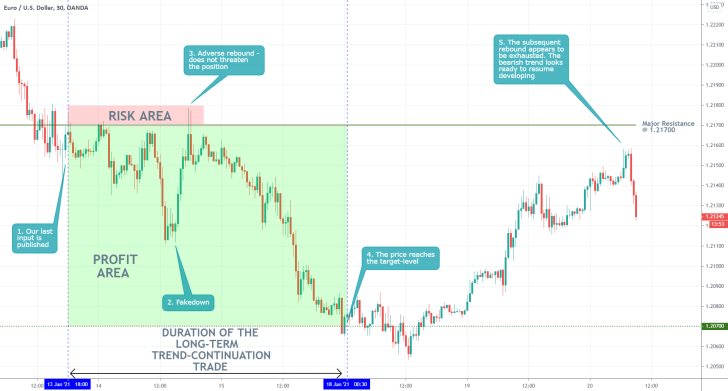
- The follow-up to the original analysis perfectly forecasted the completion of a Dead Cat Bounce setup, which resulted in the successful execution of the trade. The biggest outtake from this is that recognising patterns that typically entail trend-continuation sentiment in an evolving directional swing (trend) can be used with great success to add to an existing trade/join the developing trend anew.
- Seeing as how the price action just established a lower swing high, this very probably means that the downtrend is ready to resume developing further downs south.
Disclaimer: Your capital is at risk! Trading and investing on the financial markets carries a significant risk of loss. Each material, shown on this website, is provided for educational purposes only. A perfect, 100% accurate method of analysis does not exist. If you make a decision to trade or invest, based on the information from this website, you will be doing it at your own risk. Under no circumstances is Trendsharks responsible for any capital losses or damages you might suffer, while using the company’s products and services. For more information read our Terms & Conditions and Risk Disclaimer.


