The price action of the EURGBP has been seesawing since our last analysis of the pair as the market continues to be ostensibly range-trading. As we argued back then, the underlying market conditions are favourable for the implementation of swing trading strategies.
Seeing as how the price action is currently nearing another swing high, this could entail fresh opportunities for trading on the expectation for new swift reversals in the direction of the underlying price action.
That is why the purpose of today's analysis is to delve into the most recent developments on EURGBP's price action, and to underpin the most likely future target levels for the price action's swing lows and swing highs.
1. Long-Term Outlook:
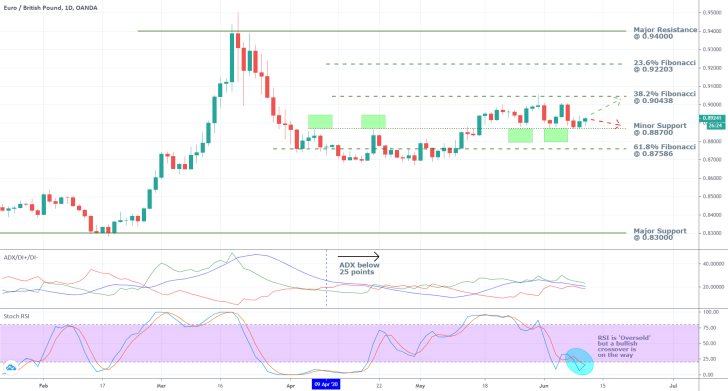
As can be seen on the daily chart below, the price action has been consolidating in a narrow range between the minor support level at 0.88700 and the 38.2 per cent Fibonacci retracement level at 0.90438 since the 17th of May – shortly before our previous analysis of the pair. Under the context of these market conditions, swing lows can be expected to reach the range's lower boundary, whereas swing highs can extend as far as its upper limit.
In case that the underlying market sentiment changes from being ostensibly range-trading to trending, then the breadth of the anticipated directional swings is going to change as well. The first significant target level for a potential new downswing is encompassed by the 61.8 per cent Fibonacci retracement level at 0.87586. Accordingly, a likely new upswing would have the 23.6 per cent Fibonacci retracement level at 0.92203 as its first significant obstacle.
Notice that the ADX has been threading below 25 points since the 9th of April, which confirms the prevalence of the underlying range-trading sentiment in the market. This, in turn, continues to decrease the likelihood for the emergence of a decisive breakout/breakdown outside of the range's territory. Moreover, the ADX has resumed falling over the last several days, which means that the price action is becoming increasingly subdued.
Finally, the Stochastic RSI has recently dropped to the 'Oversold' extreme, which underscores the heightened selling pressure in the market. Even still, whenever the indicator reaches one of its two extremes, this incentivises traders to expect another reversal in the direction of the underlying price action, given the range-trading market sentiment.
The Stochastic RSI appears ready to form a new crossover, which would underline a surge in buying orders in the short run. Additionally, such a development would favour the establishment of a new swing high towards the range's upper edge.

2. Short-Term Outlook:
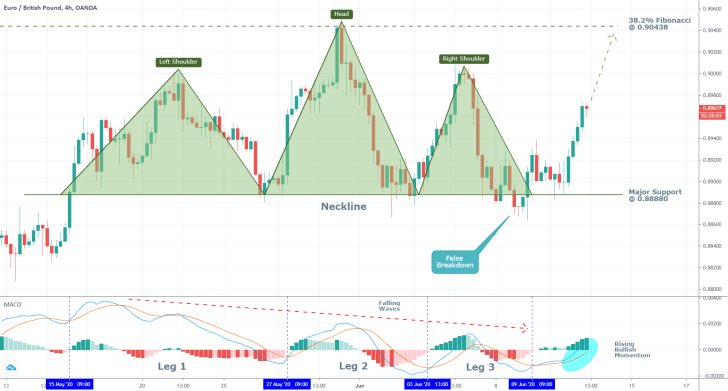
As can be seen on the 4H chart below, EURGBP's price action has recently concluded with the development of a substantial Head and Shoulders pattern, which is typically found towards the upper limit of a recent bullish trend and signifies its likely follow-up – a new bearish trend. In this case, however, the underlying price action failed to break down below the pattern's neckline encompassed by the major support level at 0.88880.
Following the termination of the false breakdown, the price action rallied, which means two things. First of all, the EURGBP evidently is not ready to finalise the broader range's development (as seen on the daily chart above). Second of all, the false breakdown is inlined with the previous assertion concerning the expectation for the formation of a new upswing. As can be seen, the price action has rebounded from the major support level at 0.88880 and is currently appreciating towards the 38.2 per cent Fibonacci retracement level at 0.90438.
Notice the MACD, which illustrates the rising bullish momentum in the short run, which is also confirming the aforementioned expectations for a new upswing. Three distinct stages are drawn on the histogram, and the falling wave lengths encapsulate the different stages in the preceding bearish momentum's development.
In other words, the wave at leg 2 is lower than the wave at leg 1. Additionally, the wave at leg 3 is positioned lower than the one preceding it. Such behaviour is to be expected in a prevailingly bearish market. However, the price action's failed breakdown signifies the end of this relationship. It could, therefore, be perceived as the initial step in the emergence of a new upswing.
Hence, the confluence of all underlying indications seems to suggest that the price action is ready to reverse itself once again from the lower end of the comprehensive range, and head further north towards its upper boundary represented by the 38.2 per cent Fibonacci retracement level at 0.90438.

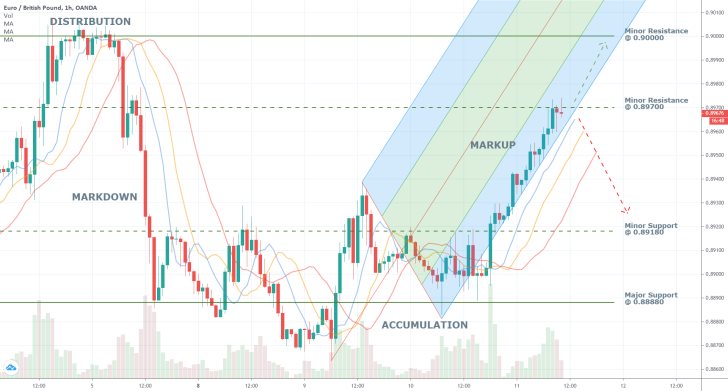
In the very short-term, the bolstered bullish momentum has caused a breakout above the minor Accumulation range's upper boundary, which is highlighted by the minor support level (previously resistance) at 0.89180. As can be seen at present, the price action is advancing further north within the lowest part of a pitchfork tool. This underscores the short-term bullish sentiment in the market.
The price action has just reached the minor resistance level at 0.89700, which served as a lower boundary for the last distribution range. A potential breakout above it is going to represent a serious challenge for the underlying bullish sentiment, as the price action would be entering the area in which the last upswing was terminated.
While the three Moving Averages – the 5-day MA (in blue), the 8-day MA (in orange) and the 13-day MA (red) – maintain their current ascending order, the price action can be expected to continue heading further north. However, if the EURGBP consolidates below the minor resistance level at 0.89700 and subsequently fails to break out above it, a new bearish retracement can be anticipated to slide back to the minor support level at 0.89180.

3. Concluding Remarks:
The EURGBP is more than likely to continue range-trading until a decisive economic development stirs the market in either direction. In the immediate future, however, the price action looks ready to resume its rebound from the range's lower boundary and to continue heading towards its upper limit, which is represented by the 38.2 per cent Fibonacci retracement level at 0.90438. This is probably going to be the new swing high, though the price action is not necessarily going to be held there.

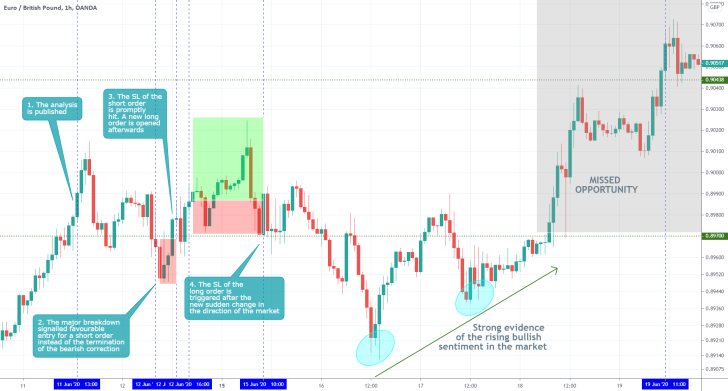
- The analysis was correct in anticipating the range-trading to continue in the mid-term. Additionally, the projection of the price action reaching the resistance at 0.90438 was also eventually realised. Overall, the analysis was mostly correct, however, it lacked precision in explaining how the underlying range-trading environment could be exploited. Such seemingly erratic fluctuations could wipe out several positions in a row, which can, then, scare traders from opening any new trades on the underlying setup out of fear of sustained losses. Traders should remember that incurring several losses in a row does not necessarily mean that their performance is poor, so they need not despair. Only calm and emotionally undisturbed traders can last long on the market.
Disclaimer: Your capital is at risk! Trading and investing on the financial markets carries a significant risk of loss. Each material, shown on this website, is provided for educational purposes only. A perfect, 100% accurate method of analysis does not exist. If you make a decision to trade or invest, based on the information from this website, you will be doing it at your own risk. Under no circumstances is Trendsharks responsible for any capital losses or damages you might suffer, while using the company’s products and services. For more information read our Terms & Conditions and Risk Disclaimer.


