Amazon reported its quarterly earnings for the period ending December 2019 the other day, and it absolutely crushed all expectations. The consensus forecasts projected Earnings Per Share of $3.98, but Amazon announced EPS of $6.47, which is one of the company's best performances on record. As a result of the overwhelmingly positive report, the company's share price jumped by more than 8 per cent during Monday's trading session, and in doing so, it surpassed the pivotal 2000 mark. This price level, as it should be recognised by everyone, has significant psychological importance due to the three zeroes at the end. Given that the price has started consolidating around 2040 in the wake of the earnings' release has prompted some analysts to question whether the price would manage to remain trading above that crucial support (previously resistance) for long. Jeff Bezos has had an excellent week so far but whether his company would succeed in preserving these gains remains to be seen. Therefore, the purpose of this analysis is to investigate the current market setup and to examine the most likely next direction for Amazon's share price.
1. Long-Term Outlook:
The weekly price chart below reveals several important aspects of the price action. First of all, this is the third time in which the price is attempting to break out successfully above the historic resistance at 2025.80. And it should be abundantly clear that just because the price has managed to surpass set level temporarily, it does not necessarily mean that the job is done. It might yet come to pass that the recent breakout turns out to be a false one, with the price reverting back below the historic resistance at 2025.80 (currently acting as a support).
Second of all, the price has been trading in an increasingly narrower channel with a flat top, as indicated by the area in purple, since the beginning of 2018. This has resulted in the creation of a 'bottleneck' effect recently, which is characterised by the close proximity between the channel's upper and lower boundaries. Typically, whenever the price action gets contained within the boundaries of such a bottleneck, the volatility gets diminished, and the market environment becomes one of range trading. In other words, the market becomes 'toned down, which is the type of condition that can be anticipated to evolve either right before the establishment of a new trend or the continuation of an old one. That is why some can take the recent break out above the confinement of the channel's boundaries as an early indication of a likely continuation of the bullish trend's momentum. On the other hand, the transition from range trading to trend trading environment cannot be confirmed solely based on one single break out, which is why long-term bulls should not become relaxed just yet.
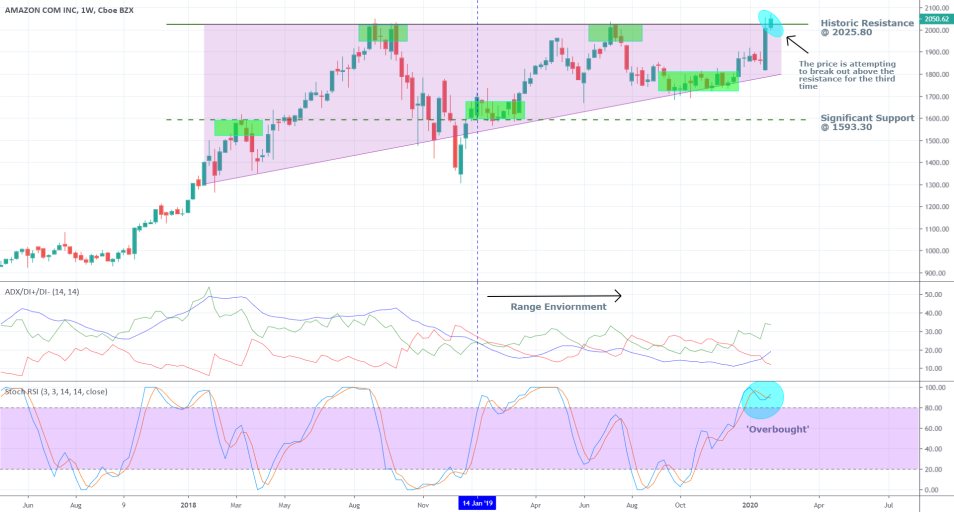
Third of all, the range-trading environment itself can be confirmed by the ADX, which has been advancing below 25 points since January 2019. That is why stochastic instruments, such as the RSI, can be used to determine the likely turning points in the price action that can prompt a change in the market's direction. Currently, the RSI has entered into Overbought territory, as indicated by the blue circle on the lower part of the chart, which does not necessarily imply a reversal in the price's direction. Still, it can prompt bulls to start closing out their positions if they believe that the range environment would persist. Since the market entered into the current range environment, the RSI has been into extreme territory twice, excluding the present case – once overbought and once oversold. In both cases, the price has remained threading within the boundaries of the range, which is leading some analysts to believe that the same might happen again for the third time.
2. Jeff Bezos and the Tech Rally:
There are some quite interesting fundamental developments happening right now, that can affect Amazon’s share price in the long-term. Jeff Bezos, the company’s CEO, has reportedly sold nearly $1.84 billion Amazon stock after the release of the overwhelmingly positive quarterly report. According to CNN, Bezos might be reinvesting his winnings into the new space race that is brewing between him and Elon Musk of Tesla.
"Jeff Bezos cashed out almost $ 2 billion in Amazon stock over the last week. It comes as the company's market capitalisation hits the trillion-dollar milestone. Where will Bezos' billions go? All signs point to his space race with Tesla founder Elon Musk. The Amazon CEO has previously said he puts his "lottery winnings from Amazon" into Blue Origin."
In the long-term, this corporate space race could lead to profound changes in the Big Tech industry, which is only going to improve the wellbeing of the likes of Bezos and Musk. In the short-term, however, this race is still in its early stages with no clear winner in sight. Meanwhile, the immediate aftereffects of Bezos' actions can be felt in Amazon's stock performance.
The nearly $2 billion sale of Amazon stock did not lead to a noticeable and sudden change in the overall market demand; however, it is the rhetoric of Bezos that can have a more significant impact on the share price. His preferred choice of words "lottery winnings" – could be taken to signify a potential disinterest in the CEO in sustaining the solid boom in the share price's bullish trend. That is not to say that he would not like to see the share price extending its current gains; however, it could mean that this is not the primary goal in the CEO's agenda.
Meanwhile, Amazon’s promising performance is the latest in a series of solid earnings that have been registered in the tech industry. Amazon, Tesla, Intel, Apple and others have reported predominantly encouraging earnings data, which is currently the best news that is coming out of the stock market. The quarterly growth in the Tech Industry as a whole is what is presently offsetting the curbing effect of the general investors’ panic that is stemming from the spread of the deadly coronavirus in China. In other words, Amazon is currently enjoying the same favourable conditions that are benefiting the other tech giants, and it is precisely this favourable environment (discounting the novel virus) that could potentially sustain the positive start to the new year for Amazon.
3. Short-Term Outlook:
The daily price chart below reveals additional interesting aspects of the most recent price action. It has recently managed to break out above the ascending accumulation stage, which predisposes for the creation of a new bullish trend (a potential markup). The markup, however, was initiated by the snap surge in the share price caused by the overwhelmingly positive earnings report. Unfortunately, the bullish price action is too recent, and there is barely any of it that can be examined. Therefore, the sustainability of the recent markup can be put into question since there is so little evidence to back up its existence.
The only evidence that is supporting the strength of the current markup is the behaviour of the price action immediately after the price managed to break out above the accumulation’s upper boundary. The formation of a throwback, which did not manage to cause a new bearish downswing, is manifesting the recent bullish momentum. In short, all the pieces are there for the establishment of a new markup; however, more time is needed to pass before it can be confirmed whether the price would manage to remain trading above the key resistance (now support) at 2025.80.
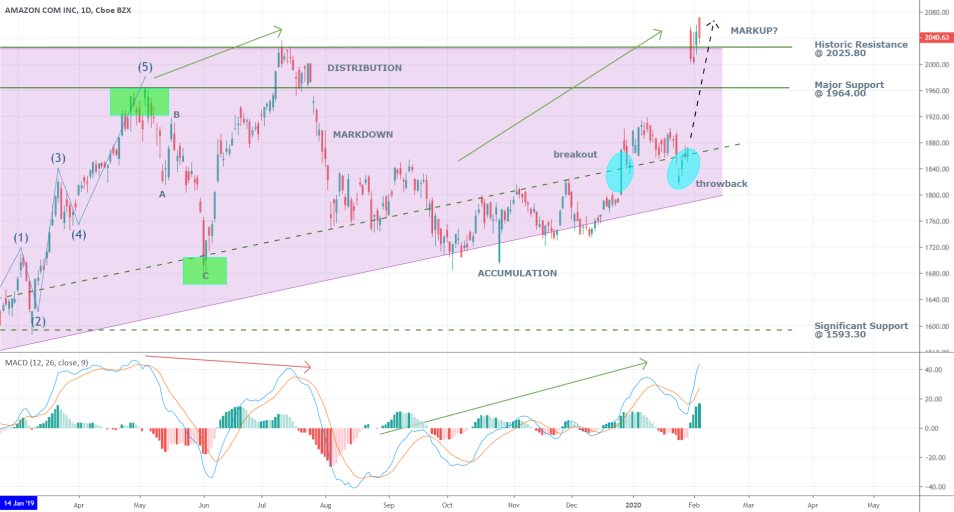
The recent ascending trend on the MACD’s waves corresponds with the rising share price above. This parallel is demonstrating the strength of the current bullish momentum, unlike the last time that the price was rising (between the fifth impulse and the last distribution) but the amplitude of the MACD was falling, which is demonstrative of waning bullish commitment.
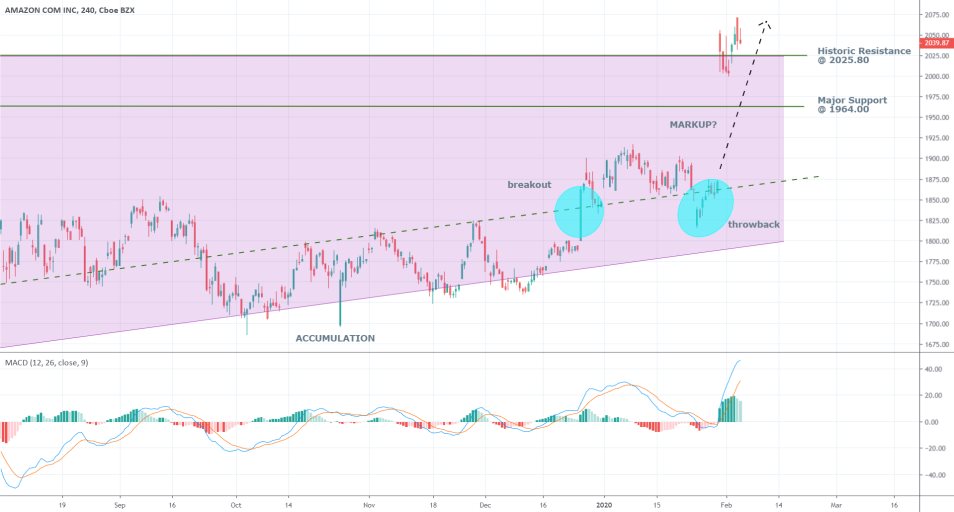
The 4H price chart, too, is illustrating the sudden change in the bullish momentum. The price has so far failed to register any substantial gains above the 2025 price level and is instead consolidating around it. This can be interpreted as an early indication of potentially waning bullish sentiment. If these assertions are later confirmed, the price can be expected to form a short-term correction next, likely to the major support at 1964.00. If this does indeed happen, the price will find itself within the boundaries of the major range that was demonstrated on the weekly chart once again. This can ultimately give the bears more reasons to believe that the range-trading environment is not yet wholly terminated.
4. Concluding Remarks:
On the one hand, bulls would be looking for evidence confirming the strength of the currently forming markup. Even if the price does correct itself to the major support at 1964.00, the bulls could still remain on top of things if the correction is proven to be short-lived. If the price falls below that level, however, the strength of the bullish sentiment would be put in question, likely prompting some of the bulls to exit their positions and thereby increasing the overall selling pressure.
On the other hand, bears would be looking for evidence supporting the assertion that the recent break out above the historic resistance at 2025.80 is a false one, and that the price would soon correct itself by falling back within the boundaries of the range. Ultimately, however, executing any short orders above the major support at 1964.00 at the current rate would be premature and too risky. For the time being the price action is still driven by bolstered investors’ enthusiasm following the release of the earnings report. It is yet to be seen whether this enthusiasm would persist and continue to support the bullish sentiment.
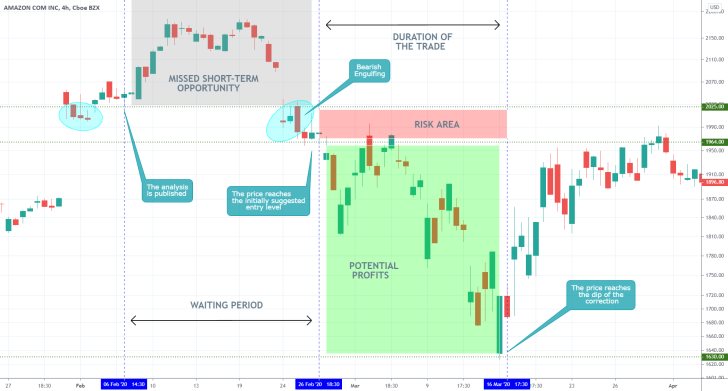
- No short-term trades were executed on this setup because the analysis emphasised on the fact that the underlying market sentiment was changing at that time. Chiefly, the bullish sentiment was still waning, which meant that no short orders could be placed around the time of the analysis' publication. As can be seen, there was quite a long waiting period before the price broke down below 1964.00, which signalled entry.
- Ultimately, the bearish correction, which was the primary point of interest of the analysis, did not reach the target level at 1593.00. The lowest point of the correction was 1630.0 The big takeaway from this is that when trading on a correction in an otherwise trending market, it is better to use floating take profit levels to hedge against sudden changes of direction. That is so because if the 1593.00 support was used as a take profit level, the price never would have reached it, and the position wouldn't have made any profits.
Disclaimer: Your capital is at risk! Trading and investing on the financial markets carries a significant risk of loss. Each material, shown on this website, is provided for educational purposes only. A perfect, 100% accurate method of analysis does not exist. If you make a decision to trade or invest, based on the information from this website, you will be doing it at your own risk. Under no circumstances is Trendsharks responsible for any capital losses or damages you might suffer, while using the company’s products and services. For more information read our Terms & Conditions and Risk Disclaimer.


