The German DAX index is currently trading at around 15700.00 basis points, which represents its all-time high. The underlying rally was fuelled by solid industry numbers in Germany for the month of May, which inspired investors to believe that the digitalisation process of the Eurozone economy is going according to plan.
While there are strong indications to confirm this, the underlying recovery in the Euro Area continues at an uneven pace. The German economic sentiment index surprisingly fell in June, which underpins this discrepancy. All of this would likely weigh down on the DAX index, just ahead of the upcoming ECB meeting in Frankfurt.
Likely Reversal from the All-Time High
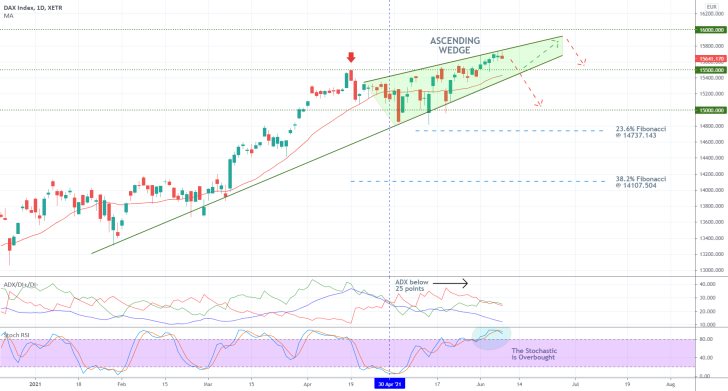
As can be seen on the daily chart below, a new bearish correction is expected to occur from the latest all-time high. This is further substantiated by the fact that the price action appears to be forming an Ascending Wedge pattern, which is typically taken to signify mounting bearish bias.
The price action managed to break out above the semi-psychological resistance level at 15500.00 only recently, which does not preclude the possibility for the emergence of a snap reversal below it. On the other hand, the price action could also appreciate towards the next psychological resistance level at 16000.00 before such a correction takes place. This would complete the Ascending Wedge pattern.
As regards the short term behaviour of the price action, the first most likely bearish test could be exemplified by a potential dropdown to the support-turned-resistance at 15500.00. The latter is currently converging with the lower boundary of the Wedge and with the 20-day MA (in red). The moving average serves the role of a floating support.
If the price of the DAX manages to penetrate below these three crucial supports, it would then be ready to potentially fall towards the next psychologically significant support level at 15000.00. The 23.6 per cent Fibonacci retracement level at 14737.143 is positioned close to the aforementioned support, which implies the likelihood of potential adverse fluctuations towards it.
Notice that the ADX indicator has been threading below the 25-point benchmark since the 30th of April, which means that the market is technically range-trading at present. The ADX fell below this crucial threshold shortly after the price had reached the previous swing peak at 15500.00.
The subsequent emergence of the Ascending Wedge underpins this ranging environment. This behaviour of the price action substantiates the expectations for an upcoming bearish correction.
Accordingly, the Stochastic RSI indicator has been threading in its overbought extreme for quite a while now, which, given the ranging sentiment, is also demonstrative of a likely reversal. Even more so, the RSI recorded a bearish crossover recently, which means that such a reversal may have already commenced.
The Ascending Wedge itself has been developing as per the expectations of the Elliott Wave Theory, as shown on the 4H chart below. Following the completion of the corrective ABC pattern (in red), the price action started establishing a new 1-5 impulse wave pattern.
It has just completed the second impulse leg (2-3) near the upper boundary of the Wedge, which increases the likelihood for the emergence of the second retracement leg (3-4). This means a potential correction towards 15500.00, as stated earlier. The resistance-turned-support level currently coincides with the lower boundary of the Wedge, making it an even more prominent target.
Moreover, the 15500.00 support is about to converge with the 100-day MA (in blue) and the 50-day MA (in green), which is why bears should not expect a decisive dropdown below this benchmark right away. Upon the completion of the dip at point 4, the price action is likely to go on establishing the final impulse leg (4-5), potentially towards the psychological resistance level at 16000.00.
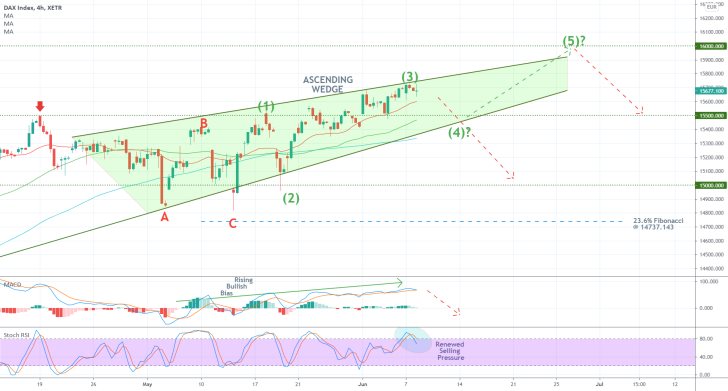
Notice that the Stochastic RSI, which is once again threading in its overbought extreme, has already started to underpin mounting selling pressure. This is happening just as the MACD indicator is illustrating peaking bullish momentum. Both of these factors could serve as likely precursors to an immediate dropdown.
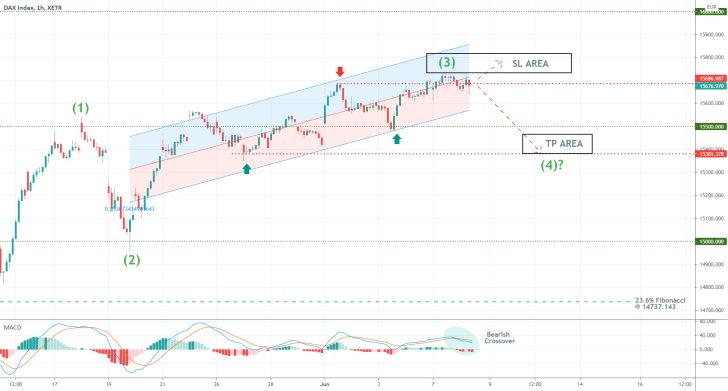
Notice that the price action has already fallen within the lower end of the regression channel on the hourly chart below. This can be perceived as a preliminary stage in the development of a new correction.
The MACD indicator has also recorded a bearish crossover over the last few hours, thereby underscoring mounting selling pressure in the short term.
Concluding Remarks
Bears looking to sell around the current market price should consider the risk area just above the peak at point 3 as the zone where they should place their stop-losses. In other words, a SL order can be placed just above the previous swing peak at 15700.00.
As regards their intended profits, bears can place a take-profit order around the previous swing low at 15400.00.
DAX Headed Towards the Psychological Resistance
German stocks are currently consolidating in a tight range as bearish pressure in the short term wanes. The DAX index strengthened last week following the June meeting of the ECB. Expectedly, Christine Lagarde, President of the European Central Bank, and her colleagues downplayed the danger of inflation in the short term.
This was a welcoming development for the DAX after the recently recorded slump in Germany's economic sentiment. Thus, everything seems to be aligning positively for the index, which now seems poised to continue climbing towards the next psychological target - the major resistance level at 16000.00.
Such directional trading is likely to commence from tomorrow morning when markets start pricing in the outcome of the highly anticipated FED meeting, which is due later today.
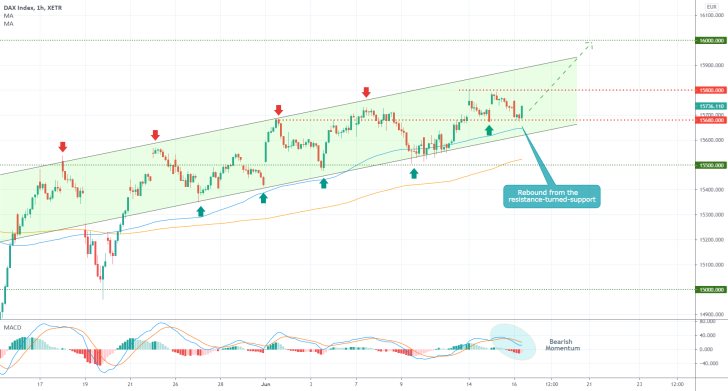
As can be seen on the hourly chart above, the price action is advancing within the boundaries of an ascending channel. This underscores the persisting bullish sentiment in the market.
The most significant development as of late was the breakout above the resistance-turned-support level at 15680.000. Further consolidation of the price action above it would allow for an eventual attempt at the aforementioned psychological barrier.
For the time being, the underlying momentum is waning. This can be seen on the MACD indicator. In all likelihood, this is the "calm before the storm". Once the indicator registers another bullish crossover, the price action would be ready to resume climbing. At present, however, this subdued environment provides bulls with the opportunity to position themselves in the market accordingly.
Notice that the 100-day MA (in blue) has been threading alongside the channel's lower boundary for quite some time now. The moving average serves the role of a floating support, making it less likely for the price to fall down below the channel's lower boundary. Even so, false breakdowns could still occur because of sudden and unexpected developments.
The support at 15680.00 is converging with the lower boundary of the channel (and the 100-day MA), which makes this a good place to consider going long. Bulls should also place tight stop losses - somewhere between the lower edge of the channel and the 200-day MA (in orange).
As stated earlier, the next target is the psychological resistance at 16000.00. If the price manages to break out above the last swing peak (at 15800.00) decisively, the bulls would then be able to move their stop orders higher to the support at 15680.00 or higher.
The DAX Index at a Critical Junction
The German DAX index is at a critical junction as stocks attempt to recuperate from a minor dropdown last week. Depending on how the price action behaves in the very near future would demonstrate the next most probable direction for the index.
Bearish pressure on the DAX index was increased recently following a sizable drop in economic sentiment in Germany. Nevertheless, ECB's commitment to remain supportive of the general recovery in the Eurozone helped investors' optimism rise once again.
Meanwhile, earlier today, the price of the DAX experienced renewed volatility outbursts following the publication of the latest industry numbers in Germany. The services PMI data surpassed the initial forecasts, underscoring faster-than-expected industry growth. In the long run, this is likely to support the DAX index.
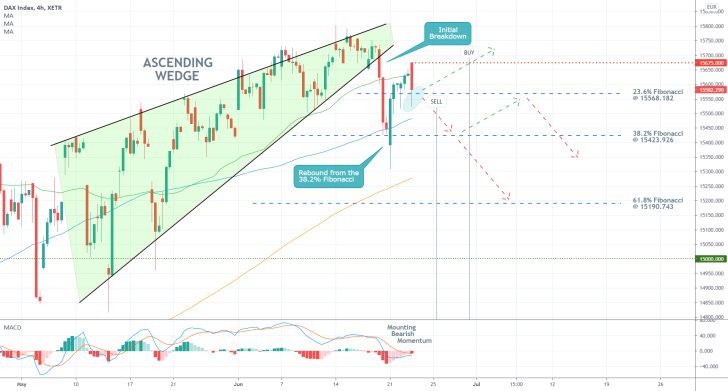
As can be seen on the 4H chart above, the price action recently broke down below the lower boundary of the Ascending Wedge. This implies the likely emergence of a new downtrend. However, there is still hope for bulls expecting faster recuperation.
As regards the underlying bullish signals, Germany's robust services PMI data could cause the price action to consolidate above the 23.6 per cent Fibonacci retracement level at 15568.182. Notice that the big lower shadow of the latest candle demonstrates strong buying pressure just below this support. This could cause the price to rebound from it.
Moreover, the snap rebound from the 100-day MA (in blue) and the 38.2 per cent Fibonacci retracement level at 15423.926 is demonstrative of the strong buying pressure around that area.
As regards the current bearish signals, the mounting selling bias is best exemplified by the MACD indicator. Moreover, the price action is currently concentrating below the 50-day MA (in green), which could be an early precursor to a subsequent dropdown.
On the one hand, bears should wait and see how the price behaves around the 23.6 per cent Fibonacci. If the 4H candle breaks down below it decisively, this could be interpreted as a selling indication. They can place a SL just above 15568.182 and try to catch a potential dropdown towards the 38.2 per cent Fibonacci. A deeper correction could sink as low as the 61.8 per cent Fibonacci at 15190.743.
On the other hand, a potential consolidation of the price action above the 23.6 per cent Fibonacci would allow for another attempt at today's swing high - 15675.00. If the price breaks out above the latter, this could be the confirmation that bulls have been waiting for. They can go long just above that level on the expectations for continued price appreciation.
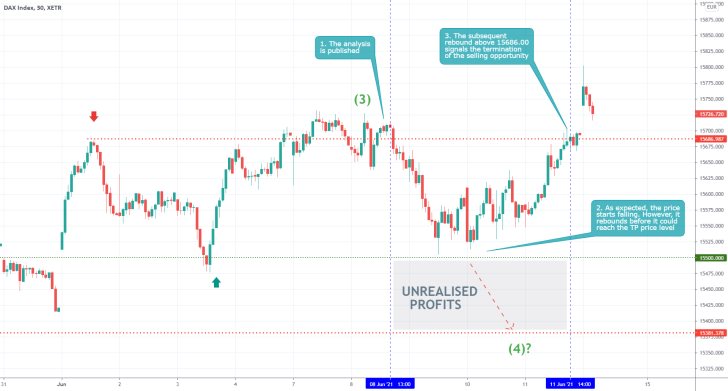
- Even though the price started to fall shortly after the publication of the analysis, it did not fall as low as projected. The retracement leg did not bottom out at (4) because a bullish rebound occurred from 15500.00.
- This setup shows why traders should opt for floating stop orders, in order to protect themselves against such sudden changes in the direction of the price.
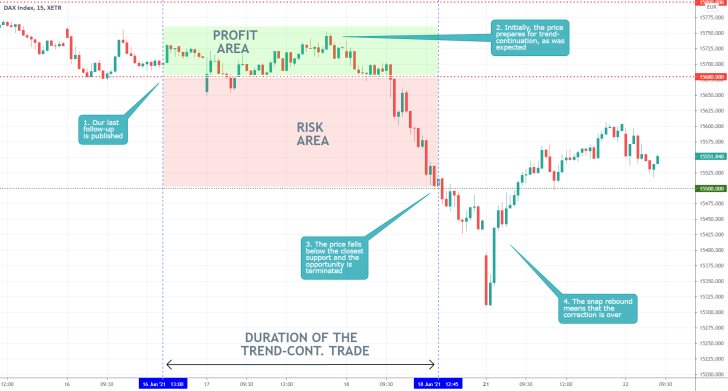
- Even though the price action went on to consolidate momentarily above 15680.00 following the release of our last follow-up, the DAX did not continue appreciating.
- The subsequent breakdown below said support signified the termination of the buying opportunity. The reason for the bearish correction was FED's June meeting.
- That is why proactive trading on stocks and indices is especially dangerous.
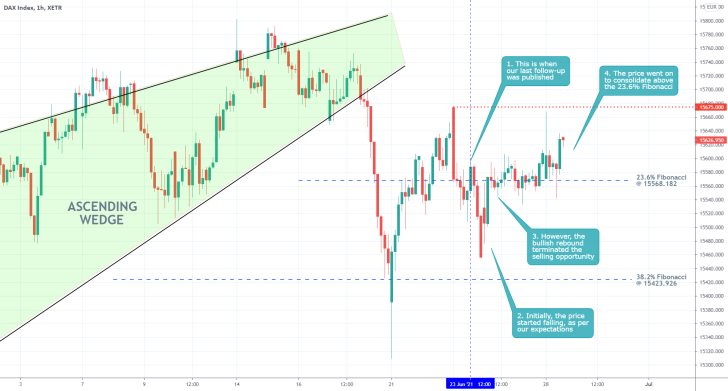
- Even though the expectations of the last follow-up for continued price depreciation were not realised, the trade succeeded in more ways than it failed.
- Selling after the second breakdown below the 23.6 per cent Fibonacci made sense given the strong bearish bias in the market. However, the snap rebound terminated the trade. That is precisely why tight stop-loss orders are needed for contrarian trading.
- Even though a small loss was incurred, the logic behind the trade was sound.
Disclaimer: Your capital is at risk! Trading and investing on the financial markets carries a significant risk of loss. Each material, shown on this website, is provided for educational purposes only. A perfect, 100% accurate method of analysis does not exist. If you make a decision to trade or invest, based on the information from this website, you will be doing it at your own risk. Under no circumstances is Trendsharks responsible for any capital losses or damages you might suffer, while using the company’s products and services. For more information read our Terms & Conditions and Risk Disclaimer.


