Earlier today, the price of the commodity rallied on the latest tribulations in the global geopolitical sphere. The escalation of tensions in Kazakhstan unnerved markets, which were already worried by the prospects of a potential Russian invasion of Ukraine. This caused an upsurge in demand for energy, thereby causing oil to rise.
Nevertheless, the price action is currently probing a major resistance level, which has served as a prominent turning point in the past. As it is about to be seen below, there are additional aspects in the behaviour of the price action, all pointing to a very probable correction. Therefore, today's analysis examines these prospects for an imminent reversal, which would allow for the implementation of contrarian trading strategies.
The market is bracing for another robust non-farm payrolls report in the U.S. tomorrow, which keeps the demand for crude high; because of the expectations for sustained recovery. This trend was further bolstered by the better-than-expected consumption numbers in the Eurozone. However, U.S. factory activity faltered in December, which is already having the opposite effect on the commodity.
That is why the underlying bearish outlook is likely to become even more pronounced over the near term as the forces of supply and demand change. Traders may take advantage of this by looking for a chance to sell the peak of the latest upswing in anticipation of another correction.
Examining the Next Most Likely Turning Point
The latest upswing was initiated following a rebound from the lower limit of an ascending channel, encompassing crude's broader rally, as shown on the daily chart below. The upswing itself is represented as a smaller ascending channel (in green).
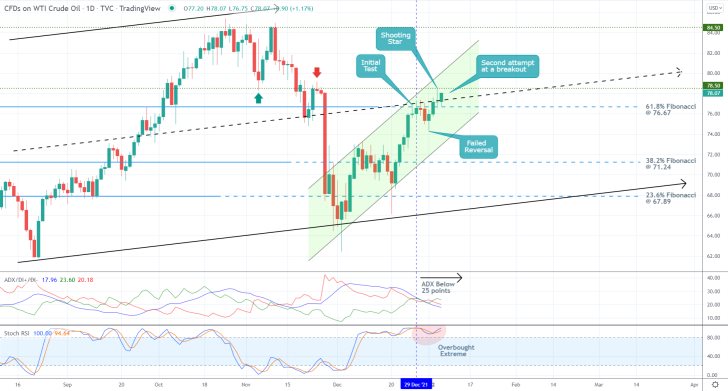
The initial breakout above the 38.2 per cent Fibonacci retracement level at 71.24 was followed by a pullback to the 23.6 per cent Fibonacci at 67.89. Then, the price action ascended to the 61.8 per cent Fibonacci at 76.67, which is currently being crossed by the middle line of the broader channel. It is this crossover between the two that gives credence to the expectations for another reversal in the very near future.
The price action is currently attempting a breakout above the two, but this could pan out to be nothing more than a misleading movement. This is corroborated by the fact that a Shooting Star candle emerged yesterday, which typically signals probable reversals from a recent uptrend. Moreover, the price action is still struggling to penetrate above the major support-turned-resistance level at 78.50.
The ADX indicator crossed above the 25-point threshold from the outset of the upswing's development, however, it once again fell below this benchmark on the 29th of December. This is demonstrative of waning bullish commitment, thereby increasing the overall likelihood of another correction emerging in the near term.
Under these conditions, the fact that the Stochastic RSI indicator continues to thread in its overbought extreme further fuels these expectations. It is likely to influence another uptick of selling pressure by bears anticipating a corrective movement shortly.
Mounting Bearish Indications in the Short Term
In preparation for such a correction, bears should pay close attention to two major support levels situated between the 61.8 per cent Fibonacci and the 38.2 per cent Fibonacci, as illustrated on the 4H chart below. These are the 75.70 support, underpinned by the 300-day MA (in purple), and the 72.90 support, underscored by the crossover between the 100-day MA (in blue) and 200-day MA (in orange).
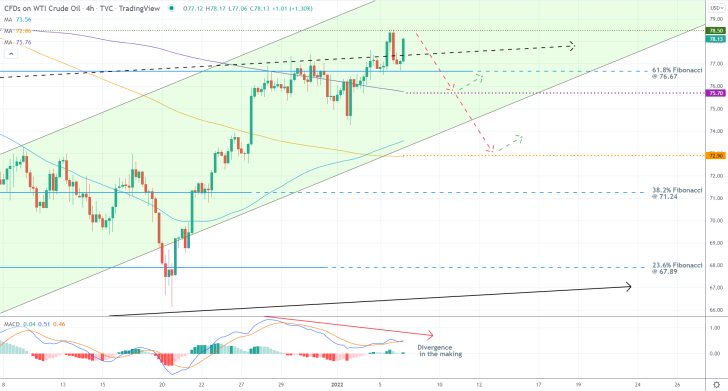
Any one of those intermediate thresholds could serve as a target for the correction, which would be confirmed by a potential retracement back below the 61.8 per cent Fibonacci.
Meanwhile, the MACD is demonstrating a divergence in the making, which supports these bearish expectations. The histogram of the indicator is falling while its two EMAs appear to be developing a new wave that is much shorter than the one preceding it. All of this points to rising bearish momentum in the short term, which is also exhibited on the hourly chart below.
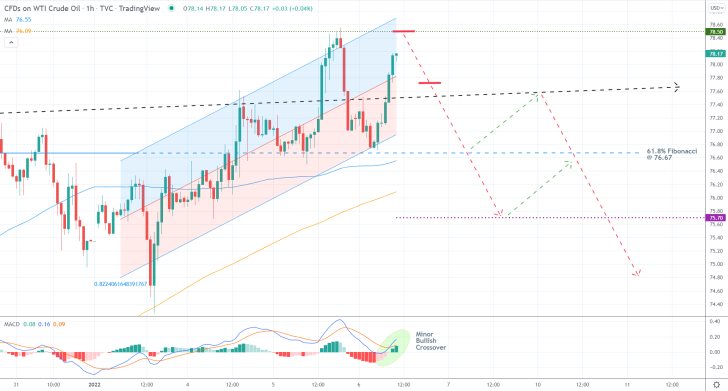
The recent rebound from the 61.8 per cent Fibonacci was followed by a breakout above the middle line of the small regression channel, which took place over the last several hours. However, the upper limit of the channel is currently converging with the aforementioned resistance at 78.50, making it an even stronger obstacle.
In turn, the 100-day MA makes the 61.8 per cent Fibonacci a stronger support by virtue of currently converging with it. The crossover of the 200-day MA above the 75.70 support has the same effect for the latter.
Concluding Remarks
Bears can look for an opportunity to sell around the 79.00 level, though this would be better suited for less risk-averse traders. Alternatively, they can wait for a dropdown below the middle line of the regression channel, around 77.70, to do so.
In either case, their supporting stop-losses should not exceed $0.50 from their initial entries. Once the price action breaks down below the 61.8 per cent Fibonacci, they could substitute their fixed stop orders for floating TPs.
Crude Oil Close to Completing a Major Bearish Crab Pattern
The price action of crude oil has been accelerating since late December when rising geopolitical tensions prompted heightened demand for energy. This trend was bolstered yesterday following FED Chair Jerome Powell's testimony before the U.S. Senate, where he commented on FED's plan to tackle soaring prices.
Powell argued that if recovery proceeds as expected, the Federal Open Market Committee (FOMC) will seek to foster price stability by means of reducing the scope of its monetary policy and asset purchases throughout 2022.
Given that overall liquidity would likely drop considerably when the eventual policy tightening is introduced, there would very probably be a spillover effect on the stock market as well as the energy market.
Demand for the commodity is likely to fall parallel to FED's reduction of demand-bolstering policies. This is what sets the stage for a possible correction of WTI in the short term, as the market prices in the likely consequences from yesterday's testimony.
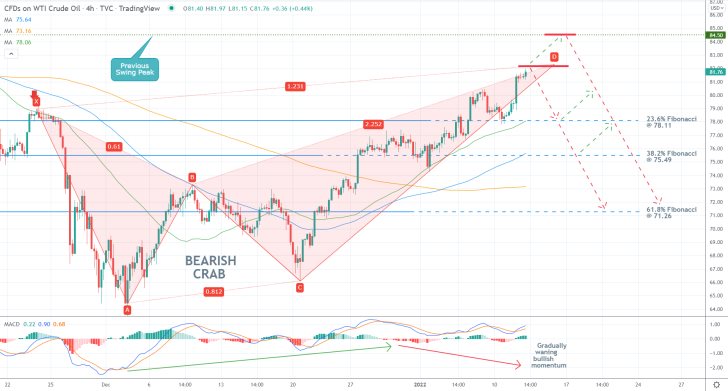
The most significant possible indication of an upcoming dropdown on crude oil is the current development of a Bearish Crab structure, which is a classic trend reversal pattern. The pattern seems poised to be completed just below the previous swing peak at 84.50, which further confirms the underlying expectations.
Moreover, the declining waves of the MACD indicator that are comprised of its two EMAs - the 12-day EMA (in blue) and 26-day EMA (in orange) - seem to be underpinning a divergence in the making. The waning bullish momentum can also be considered as a potential precursor to an upcoming bearish reversal.
Bears can take advantage of this opportunity in one of two ways. They can either open short market orders around the current spot price, or place short limit orders at the previous swing peak at 84.50. Regardless of what they choose, their supporting stop-loss orders should not be placed higher than $0.50 from their initial entry levels.
The first target for the correction would be the 23.6 per cent Fibonacci retracement level at 78.11, which is currently converging with the 50-day MA (in green). A deeper target is underscored by the 38.2 per cent Fibonacci at 75.49, which is currently being crossed by the 100-day MA (in blue).
In case that there is a really strong bearish commitment in the market, the dropdown could reach as low as the 61.8 per cent Fibonacci at 71.26, provided that it manages to penetrate below the 200-day MA (in orange).
Is it Time for a Correction on Crude from a Two-Month Peak?
Earlier today, the price action of crude oil reached a major resistance level that was last tested in mid-November. Given the prominence of this historical threshold, a long-anticipated bearish correction may ensue soon.
The demand for the commodity subsided after it was revealed that the pace of Chinese economic growth contracted by nearly 1.0 per cent from the third quarter. This is what entailed a probable decline in demand for energy in the foreseeable future.
This trend could be further bolstered throughout the week as the earnings season picks up steam. Some of the biggest U.S. financial companies are due to report their quarterly performances starting from Wednesday, which could reinvigorate investors' interest in stocks and higher-risk assets.
This does not necessarily mean that crude oil's current upswing is due for immediate termination, simply that the changing market dynamics in the short term are likely to increase the likelihood of a minor correction developing next.
That is why the underlying set-up seems suitable for the implementation of contrarian trading strategies, though traders should keep in mind that those would entail a high degree of risk.
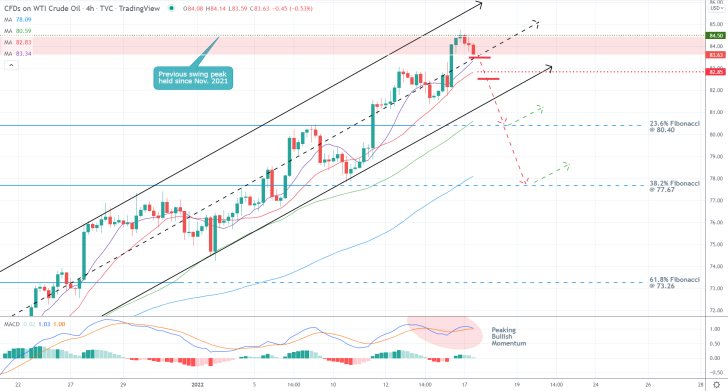
Over the last several hours, the price action reversed from the aforementioned resistance level at 84.50, as shown on the 4H chart above. The correction may therefore have already started.
The MACD indicator further underscores the waning bullish momentum. The histogram has been declining steadily over the last couple of weeks while the waves of the indicator are becoming increasingly shorter; this entails a possible divergence in the making, which is to be expected if a correction is due next.
Presently, today's dropdown is probing the middle line of the ascending channel, which is converging with the 10-day MA (in purple), representing the first major obstacle to a new correction.
Depending on their level of risk-aversion, bears could either sell around the current spot price or place short limit orders just below the minor support level at 82.85. The latter is underpinned by the 20-day MA (in red). In both cases, they should utilise stop-loss orders that are placed no more than $0.50 away from their initial entry levels.
The first target for the correction will be the 23.6 per cent Fibonacci retracement level at 80.40, which was recently crossed by the 50-day MA (in green). The second target can be found at the 38.2 per cent Fibonacci at 77.67, currently converging with the 100-day MA (in blue). Both represent very probable turning points.
Once the price action breaks below the lower limit of the ascending channel, bears would be able to move their stop-loss orders to breakeven in order to protect themselves against snap bullish pullbacks.
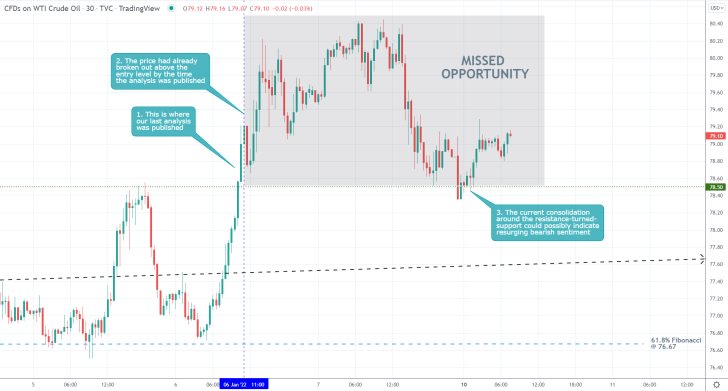
- The expectations of our last crude oil analysis were not realised, but at least no losses were incurred. That is so because, by the time of its publication, the price action had already broken out above the selling level.
- Sometimes the market gets too volatile and you might miss your preferred entry. In such cases, it is better to refrain from entering the market at a deeper/higher level than initially desired because that would mean disregarding the rules of your trading strategy.
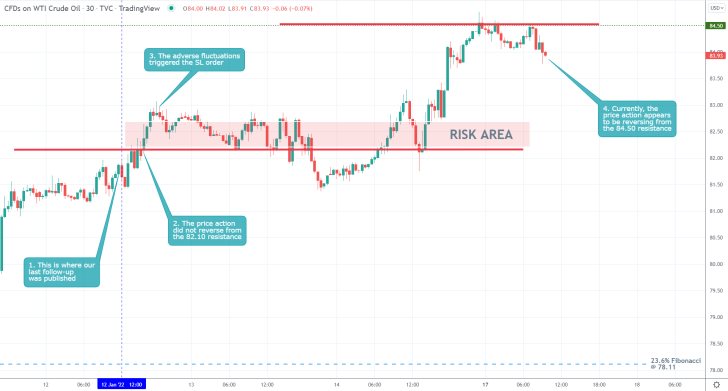
- The forecasts of our last crude oil follow-up were not realised. A Bearish Crab patter was not completed around the 82.10 resistance level. The eventual breakout above it triggered the stop-loss order.
- At least the SL was positioned close to the resistance, preventing much bigger losses.
- This is a good example of why contrarian trading entails such a high degree of risk.
- Presently, the price action appears to be attempting a reversal from the previous swing peak at 84.50, which could entail the beginning of a long-anticipated bearish correction.
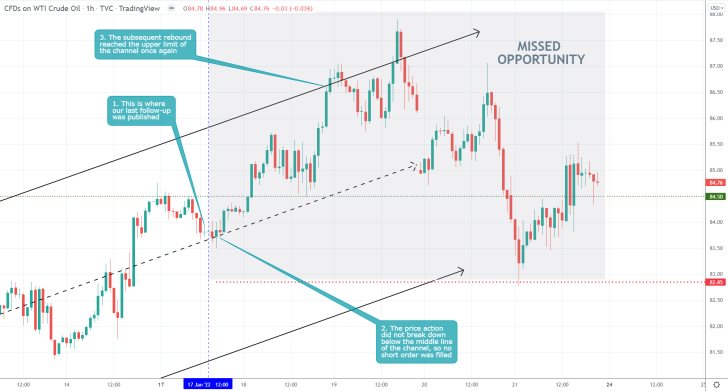
- The forecasts of our last crude oil analysis were not realised. The price action did not break down below the middle line of the ascending channel decisively and instead rebounded towards the upper limit of the channel.
- Hence, a trend continuation trading opportunity for bulls was missed by failing to trade on this bullish rebound.
- However, the price action at least did not reach the bearish entry levels, which is why no losses were incurred on this set-up, either.
Disclaimer: Your capital is at risk! Trading and investing on the financial markets carries a significant risk of loss. Each material, shown on this website, is provided for educational purposes only. A perfect, 100% accurate method of analysis does not exist. If you make a decision to trade or invest, based on the information from this website, you will be doing it at your own risk. Under no circumstances is Trendsharks responsible for any capital losses or damages you might suffer, while using the company’s products and services. For more information read our Terms & Conditions and Risk Disclaimer.


