The price of crude oil has been trading horizontally in a very tight range since the beginning of June. So far, the commodity's bullish run, which was initiated in the wake of the oil market crash, appears to have reached a deadlock, and is struggling to advance higher. Oil's price has been trading around the psychologically important threshold of 40 dollars per barrels since the 5th of June. However, it has been unable to break out above this level successfully, which many bears are starting to perceive as a potential turning point in the market.
The demand for the precious commodity typically falls during the summer months, which is caused by diminished industrial activity in the advanced economies during the summer holidays. This year the muted demand for fossil fuels is further exacerbated by the pandemic, as the number of confirmed cases continues to rise in the US, and elsewhere.
Even more so, there is a crucial OPEC meeting, which is scheduled to take place this Thursday. The last time the oil ministers of the states participating in OPEC met, the price of the commodity plummeted immediately following the conclusion of the meeting. Similar volatility outbursts could be expected to take place this Thursday.
The underlying fundamental factors seem to signal mounting selling pressure in the oil market. Additionally, the inability of oil's price to continue rising past the 40.00 mark is quite telling of the currently changing sentiment. Therefore, the purpose of today's analysis is to examine those shifting market pressures and to determine whether a new downswing could emerge next.
1. Long-Term Outlook:
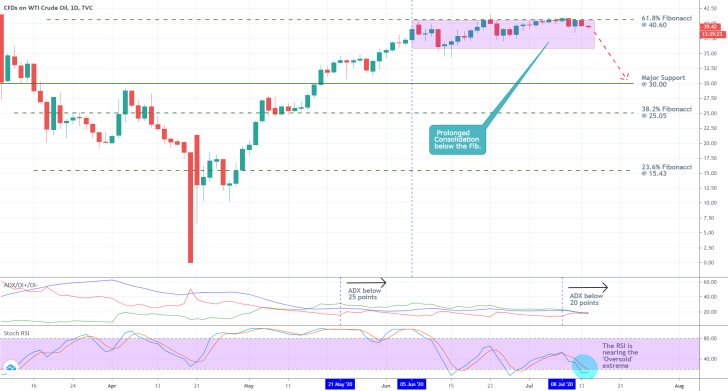
As can be seen on the daily chart below, crude oil's price action has been contained within the boundaries of a narrow consolidation range since mid-May. The 61.8 per cent Fibonacci retracement level at 40.60 serves as the range's upper boundary, whereas the major support level at 30.00 serves as its lower boundary. Both levels are psychologically significant.
Since the 5th of June, there have been 11 failed attempts at a break out above the range's upper limit, which manifests the strength of the resistance level there (the 61.8 per cent Fibonacci). The price action's narrow consolidation just below the upper limit of the range for so long without forming a decisive breakout is what gives prominence to the expectations for a reversal.
The aforementioned fundamentals are significant enough to cause such a dropdown – these projections are supported by the implemented technical analysis of the price action's current state. If the market does indeed develop in such a manner next, the price of crude could tumble by more than 10 dollars before it finds support (the range's lower boundary).

The ADX indicator has been threading below the 25-point mark since the 21st of May. Moreover, it fell below the 20-point mark last Wednesday, which confirms the significance of the current range-trading sentiment in the market. The emergence of a new downswing under these conditions seems highly probable.
The Stochastic RSI indicator continues to highlight a rising selling pressure; however, it is currently reaching into the 'Oversold' extreme. This does not necessarily mean that the underlying buying pressure would immediately start to rise from here on out. However, it does allude to a plausible change in the underlying equilibrium between the buying and selling pressures in the near future.
2. Short-Term Outlook:
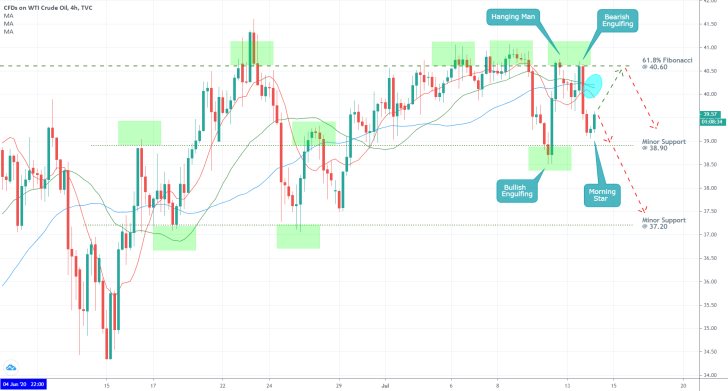
As can be seen on the 4H chart below, the seemingly erratic fluctuations of the price action become much more pronounced when analysed on a chart with a smaller timescale.
On the one hand, the formation of the 'Hanging Man' and 'Bearish Engulfing' candles close to the 61.8 per cent Fibonacci retracement level signal the build-up of bearish sentiment. On the other hand, the emergence of a 'Bullish Engulfing' candle coupled with a 'Morning Star' above the minor support level at 38.90 points to the existence of bullish commitment in the market as well. Overall, this seemingly undetermined price action can be perceived as a transitionary stage. We could see more intermittent trading before the build-up of bearish pressure is strong enough to develop the anticipated downswing.

Despite the inability of the price action to commence depreciating right away, it has already started to form lower peaks, which is an inherently bearish behaviour. Moreover, the market bears could exploit the situation by waiting for the establishment of a new peak, so that they can open selling orders at a more advantageous level.
Notice the blue area – the 10-day MA (in red) is already diverging away from the 30-day MA (in green), which recently crossed below the 50-day MA (in blue). This is demonstrative of rising bearish momentum and supports the primary expectations.
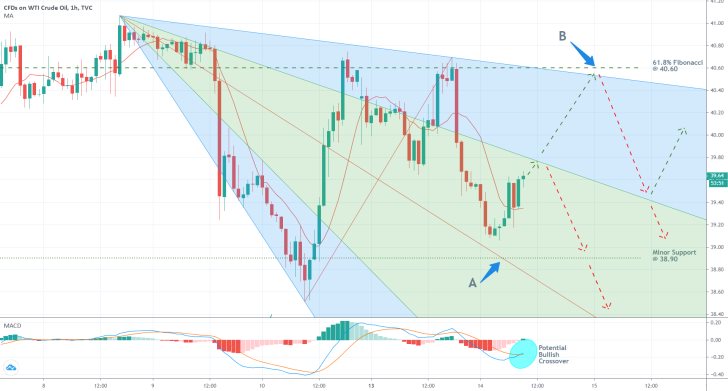
In the very short-term, the price action recently rebounded from point A, which marks the convergence between the pitchfan tool's middle line and the minor support level at 38.90. A similar rebound could be expected to occur if the market heads towards point B next. The latter indicates the convergence between the 61.8 per cent Fibonacci retracement level at 40.60 and the pitchfan tool's highest boundary.
The currently developing bullish crossover on the MACD indicator underpins the risks from premature selling. The market could resume going north, up to the range's upper boundary, before the remaining bullish commitment is completely exhausted, and the price of oil starts going down.

3. Concluding Remarks:
There are very few reasons to expect a break out above the 61.8 per cent Fibonacci retracement level at 40.60. At present, the confluence of technical and fundamental indicators supports the anticipations for a trend reversal towards the major support level at 30.00. Nevertheless, market bears should be cautious, as the price could continue consolidating in range before a more sizable dropdown is registered.

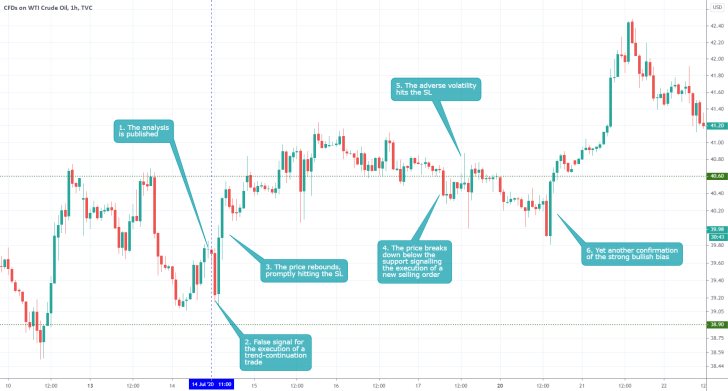
- The underlying fundamental factors were completely misconstrued by the analysis, which led to the incurred losses. Chiefly, the market sentiment was mistaken – it was ranging at the time of publication, not forming a new bearish downtrend. Sometimes traders can incur losses from positions that have been wiped out by adverse volatility, as the market transitions, which was the case with the previous journal entry. In such instances it is OK to execute multiple trades until you get a favourable entry, for as long as the underlying pieces of evidence continue to point to the same direction. However, when the market is sending mixed messages, such as the case above, you should refrain from trading on the anticipation of a new reversal.
Disclaimer: Your capital is at risk! Trading and investing on the financial markets carries a significant risk of loss. Each material, shown on this website, is provided for educational purposes only. A perfect, 100% accurate method of analysis does not exist. If you make a decision to trade or invest, based on the information from this website, you will be doing it at your own risk. Under no circumstances is Trendsharks responsible for any capital losses or damages you might suffer, while using the company’s products and services. For more information read our Terms & Conditions and Risk Disclaimer.


