The price of crude oil bounced back up today by nearly 7 per cent from a low that has not been reached in almost two decades. The price rose from the historic support level at 20.00 dollars per barrel after it was announced that Donald Trump and Vladimir Putin held talks over the phone yesterday. According to people familiar with the matter, they discussed the prospects of working together to stabilise the jolted energy market.
“President Donald Trump said he’s concerned oil prices have fallen too far and called Vladimir Putin on Monday to discuss Russia’s oil-price war with Saudi Arabia. The leaders, who also talked about the spread of the coronavirus, agreed to discussions on oil between energy officials in the two countries, according to the Kremlin. Both leaders “agreed on the importance of stability in global energy markets,” the White House said in a statement.”
These recent developments have recouped some of the shattered investors' optimism after the market was flooded with cheap crude oil that nobody wants. The distortions in the market's supply and demand equilibrium were prompted three weeks ago when Russia and Saudi Arabia stirred a so-called price war with each other. The trade tensions were escalated after the energy ministers of the two countries failed to reach a consensus agreement regarding cutbacks in production at the last OPEC+ meeting in Vienna.
The adverse magnitude of the resulting market shock, which was prompted after the negotiations in Vienna stalled, was amplified by the evolving coronavirus situation, which is impeding the global economy and distorting the international supply chains.
In the wake of all of these developments, the price of crude oil is trading at around 20 dollars per barrel, which is a substantial price level for a number of reasons. That is why today’s analysis reviews the most recent fundamental developments in the market and the technical outlook of crude oil’s price action.
1. Long Term Outlook:
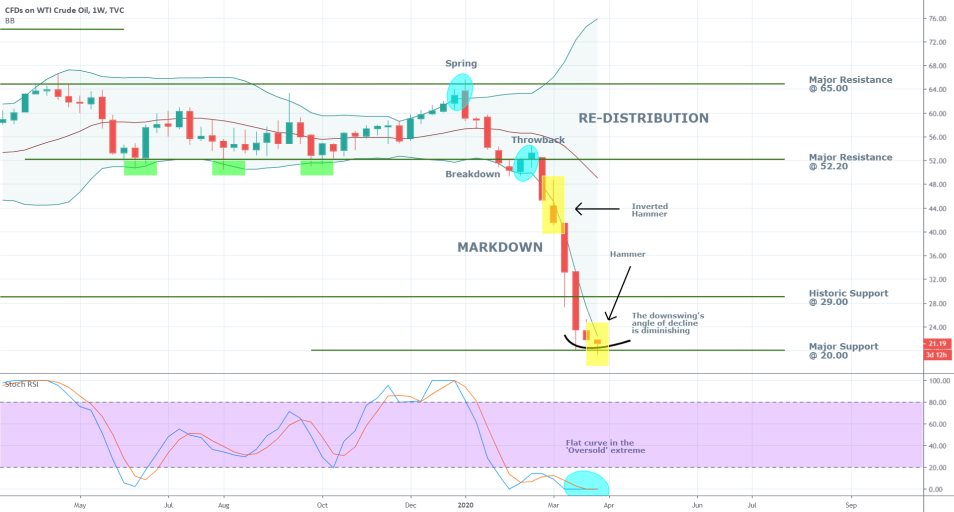
Crude oil tumbled by more than 60 per cent since the price war was initiated, but now there are early since of potential stabilisation in the market. As can be seen on the weekly chart below, the significant bearish trend appears to have started to flatten over the last two weeks. Its angle of depreciation seems to be diminishing, which is illustrative of waning bearish sentiment. It should be stressed, however, that this does not necessarily mean the trend is now terminated.

If the selloff is halted here and the price starts consolidating, this could be interpreted as the potential early stages in the development of a new Accumulations range. Such a range is likely to have the major support at 20.00, which has tremendous psychological importance due to the three zeroes in the number, as its lower boundary; and the historic support (currently serving as a resistance) level at 29.00, as its upper boundary.
The behaviour of the price action is one evidence pointing to the likelihood of new consolidation. The appearance of the inverted hammer right before the significant selloff was evocative at the time of accelerating bearish momentum. In contrast, this week appears to be forming a regular hammer, which is a candlestick that is commonly found at the lower end of a bearish trend. Its appearance around the psychologically important support level at 20.00, coupled with the small-sized bodies of the previous two candlesticks and the flattening slope of the downswing, all seems to be confirming that the bearish sentiment is waning.
Finally, the Stochastic RSI is currently threading in the 'Oversold' extreme, but its curve appears flat. This means that the underlying sentiment remains decidedly bearish, but it is no longer gaining momentum, which is inlined with the previous assertion. Thereby, it is way too early to be talking of completely thwarted bearish sentiment; however, it appears as though the market finds itself in the early stages of establishing a new transitionary process. In other words, we could be seeing the beginning of the end for the underlying bearish trend, which could be followed by a bounce up in crude’s price.
2. The Epicentre of the Price War is Shifted:
Traders have started considering the likelihood of a rebound in the energy market today, following Donald Trump's conversation with Vladimir Putin. That is so because evidently, the nature of the price war has changed now that the US is more directly involved.
Initially, Donald Trump failed to mitigate the spat between Riyadh and Moscow, and consequently, the price of crude oil plummeted by 10 dollars in less than 10 days since the height of the price war. As we argued in our comprehensive analysis from the 20th of March, Donald Trump did not sound quite decisive in his rhetoric, which lessened the position of the US as a mediator between the two sides.
This observation was made in relation to the President’s statement from a day earlier when he said:
"Well, the one thing I will tell you is that from the standpoint — you always get a little bit torn because, you know, until we became the leading producer, I was always for the person driving the car and filling up the tank of gas. And you'd have gasoline, and the prices were — if they were too high, I would always raise hell with OPEC. […] And, in one way, our consumer is very much helped. It’s like — it’s like a massive tax increase. […] But, on the other hand, it hurts a great industry and a very powerful industry.”
It seems that since then, the tables have turned and Trump's priorities have changed. The President gave an extensive interview for “Fox&Friends” yesterday, in which he lashed out against the price war, and by that extent against Russia and Saudi Arabia by saying that they “both went crazy”.
"I never thought I'd be saying that maybe we have to have an oil [price] increase because we do. The price is so low. […] The price is so low now they are fighting like crazy over, over distribution and over how many barrels to let go."
Trump pledged to have talks with Putin in order to calm the markets, which prompted today’s rally in the underlying price of WTI crude. Based on the interview, it looks as though Trump would attempt to persuade the Russian President to cooperate with the member-states of OPEC and OPEC+ by reaching a mutually satisfying agreement on appropriate reductions in production.
This behaviour of his is inlined with the projections we expressed in our article from earlier today, in which we argued that he would most likely attempt to influence Russia’s ultimate decision. Trump's alternative to diplomacy is, as usual, sanctions. He could opt to impose new rounds of sanctions on Russia in case Putin refuses to cooperate with OPEC, in which case the negotiations impasse could become an international relations issue.
At any rate, it appears that all sides are (for the time being) committed to stabilising the jolted energy market by driving the price of crude oil back to a steadier level. That is why the underlying fundamentals seem to favour the appreciation of crude's price in the midterm; however, the situation is fragile, and the negotiations between the US, Russia, Saudi Arabia and the rest of OPEC could hit a new roadblock in the future.
3. Short Term Outlook:
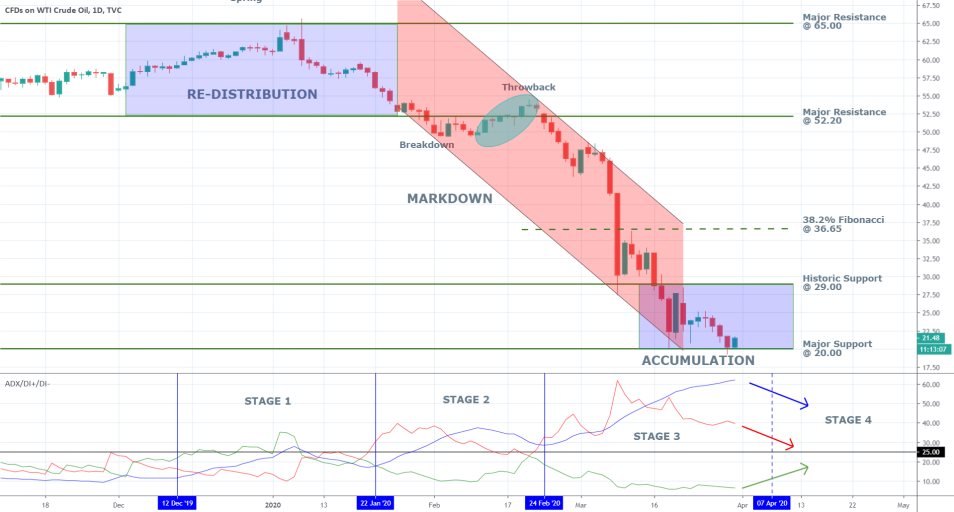
The daily chart below categorises the three different modes of the price action – the Re-Distribution; the Markdown; and the currently evolving Accumulation.
The ADX indicator is currently threading way above the 25.00 mark, which outlines the highly robust underlying trending environment. We have sketched out three distinct stages in the progression of the price action.
Stage 1 underscores the price action during the formation of the Re-Distribution stage, where the bearish sentiment started mounting up. This gradually prompted the ADX to begin appreciating and surge above the 25 index points threshold. Stage 2 outlines the eventual breakdown and the subsequent throwback to the major resistance at 52.20, which is typical behaviour during the formation of new trends. That is when the ADX started really picking up above 25 points, despite the somewhat muted price action. Stage 3 reflects on the main body of the Markdown when the ADX registered its most significant gains.

Based on the above observations, we can now estimate that the market is currently transitioning into a new stage. Stage 4 anticipates the ADX to reach a peak around its current level and start falling afterwards, which would support the formation of the expected Accumulation range. Additionally, D+ is expected to bounce up from the current bottom, whereas D- is likely to continue converging towards the 25-point mark. All of these assertions anticipate the underlying price action to continue consolidating between the historic support at 29.00 (currently resistance), and the psychologically important support level at 20.00. False breakouts and breakdowns outside of the range’s boundaries are also possible to form while the Accumulation develops.
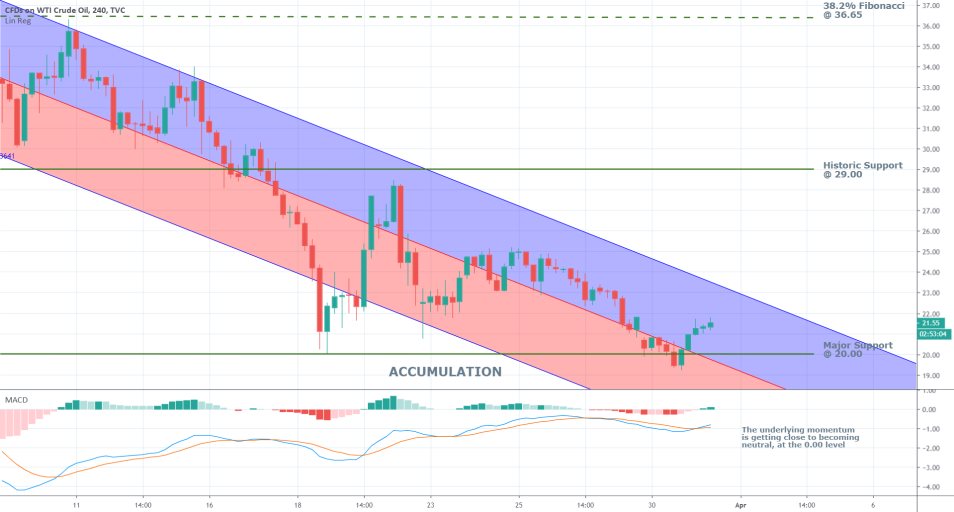
The 4H chart below demonstrates that the price action has already passed into the upper part of the regression channel after having bounced back up from a dip before, which underpins the rising bullish sentiment in the short run. The channel’s middle line has passed below the major support level at 20.00, which is another positive piece of evidence anticipating the consolidation of the price action following the termination of the recent bearish trend.

The underlying momentum remains inclined to the downside; however, the MACD has almost reached the 0.00 neutral level. At this point, there will be complete neutrality between the bullish and bearish momentums in the short run.
4. Concluding Remarks:
The market continues to be quite volatile as the broader fundamental factors affecting it have started to shift following yesterday's developments. Therefore, there are reasons to expect that the long term crude oil selloff might have reached a bottom; however, a correction is going to take a whole to develop. We are expecting the formation of a transitionary stage, during which the price action is likely to consolidate between the boundaries of the aforementioned Accumulation range.

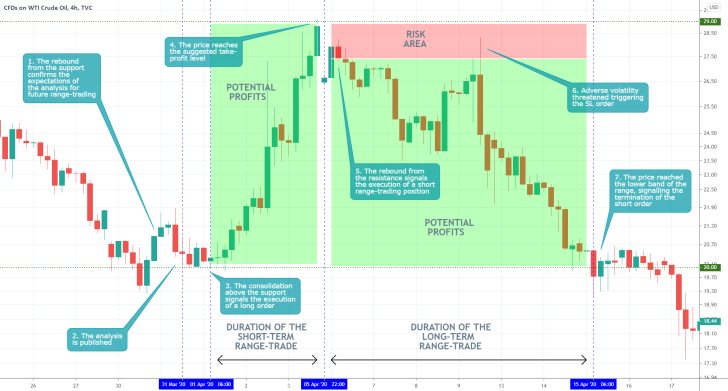
- The analysis was correct in estimating that the price of oil would continue consolidating in a tight range spanning between 20.00 and 29.00. This allowed for the execution of two profitable range-trading positions in a succession. Observing the behaviour of the price action around the borders of a clearly distinguishable range is especially important for the implementation of such range-trading strategies. Arguably, the only time that the logic behind "sell high and buy low" works best is when the market is indeed ranging, whether it be in the short or the long term. Nonetheless, the analysis was, in hindsight, wrong in expecting that the market had reached a dip, as the price war between Russia and Saudi Arabia would eventually drive the price of crude oil to negative levels.
Disclaimer: Your capital is at risk! Trading and investing on the financial markets carries a significant risk of loss. Each material, shown on this website, is provided for educational purposes only. A perfect, 100% accurate method of analysis does not exist. If you make a decision to trade or invest, based on the information from this website, you will be doing it at your own risk. Under no circumstances is Trendsharks responsible for any capital losses or damages you might suffer, while using the company’s products and services. For more information read our Terms & Conditions and Risk Disclaimer.


