Crude oil is currently attempting to make a crucial breakdown below an important support level, which would blast the price to a 3-years low. The week began more than promising for the precious commodity, which climbed with nearly 5 per cent during Monday’s trading session. However, things have been steadily deteriorating since then, and the price is currently attempting to close down below the significant support level at 45.00.
Unsurprisingly, the muted demand pressures are resulting from the coronavirus outbreak. The fall in crude oil demand is a symptom of inhibited industrial activity in China and elsewhere. The global aviation industry is the brightest example of the negative impact of the virus’ spread on a part of the economy, which, in turn, is having a decisive spillover effect on the demand for oil. That is why OPEC and OPEC+ (comprising of oil-producing countries that are not among the original members of the cartel) are currently meeting in Vienna to discuss how the situation can be stabilized.
Market experts are projecting an agreement to be reached promptly, involving massive cuts in production in a bit to prevent the prices from falling even lower. Such measures would intentionally decrease the global supply output, which should offset the negative impact of the falling industrial demand for oil in China and elsewhere.
As the negotiations between the energy ministers of the biggest exporters and producers of crude oil continue even now, the price of the commodity keeps on falling on speculations that Saudi Arabia – the de facto leader of OPEC – and Russia cannot strike a mutually beneficial deal. It is feared that failure to reach a deal for the reduction in production would leave the issue of falling demand virtually unaddressed.
Thus, the price of crude oil could continue falling in the short run without the implementation of any meaningful countermeasures. Some specialists have asserted that the price could tumble to as low as $30 per barrel - historical support that was last reached during the previous oil crisis in early 2016 – before the tide can be turned.
The purpose of today's analysis is to underpin the essential points in the negotiations process between Russia and OPEC and to examine what are the possibilities for the price action of the commodity in the foreseeable future.
1. Long Term Outlook:
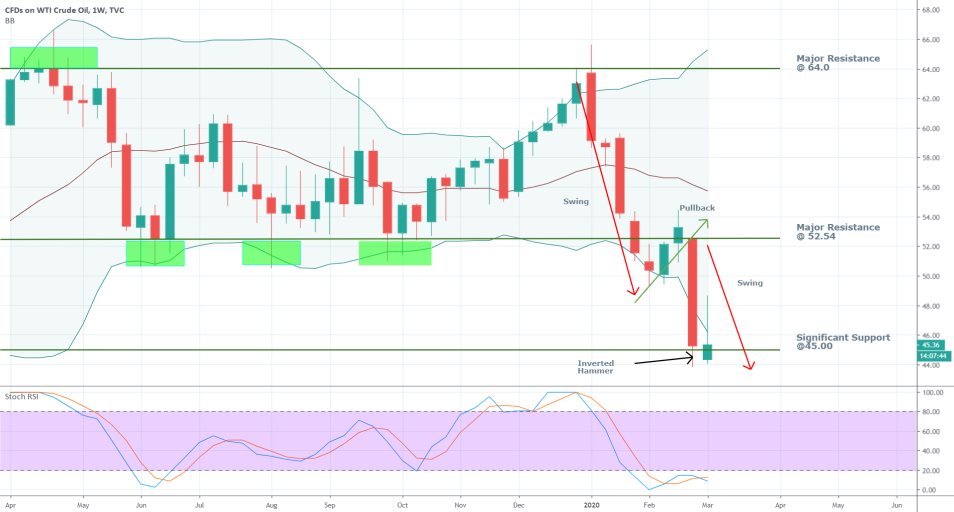
The 1W chart below demonstrates the strength of the current bearish sentiment. The downtrend, which was initiated after the price failed to break out above the major resistance level at 64.0, has so far followed a classic pattern. There are two swings with an intermediate pullback, which happens to be exhausted just above the major resistance level at 52.54.
Depending on how the price behaves around the next crucial level – the significant support at 45.00 – it would illustrate whether the downtrend is nearing its termination, or the second swing could continue to dig deeper.

The candlestick representing this week's price action is currently taking the shape of an inverted hammer, which is commonly found towards the end of a bearish downtrend and is understood to represent the potential waning of the downtrend’s strength. However, it shouldn’t be traded on at face value as a signal for entering the market long. Inverted hammers could also form as interim glitches in the price action, that cannot change the direction of the prevalent trend.
In the present case, the most important thing to consider is how this week's trading session will end, and what will be the relation of the candle's body to the aforementioned support level. If the body of the candle closes above the significant support level at 45.00 and the lower Bollinger Band, this would indicate strong bullish commitment in the short term. However, if it instead finishes below the lower BB and the support level, this would mean that the attempt at a bullish correction is a failed one and that the bearish downtrend is more than likely to continue developing next week.
The stochastic RSI looks set to complete a new bearish crossover, which would favour the longer-term bears, despite already being in the 'Oversold' extreme. Normally, the indicator's current readings would likely prompt the execution of new long orders on the presumption that the direction of the price action is about to change. Subsequently, the gradually rising demand would eventually tip the supply and demand equilibrium, likely resulting in the formation of a new bullish trend. However, since the market is already trading in a pronounced bearish trend, which is quite solid, the RSI alone may not be sufficient enough to prompt such behaviour. Thereby, the underlying market sentiment is likely to remain distinctly bearish over the weekend.
2. Russia Playing Hardball in Vienna:
The turmoil in the energy market was increased today as Saudi Arabia and Russia appear to have reached a gridlock in the OPEC+ negotiations on the appropriate reductions of oil production that are to be implemented by the end of the year. According to people familiar with the matter, cited by the Financial Times:
“Opec’s members are proposing cutting production by an additional 1.5m barrels a day to try to support a market crippled by the drop in aviation and transport demand […] The deal could take total production cuts by the Opec+ group – which includes Russia and other producers outside the cartel – to 3.6m barrels a day, or almost 4 per cent of world demand, and would represent the biggest reduction in more than a decade.”
Alexander Novak, Russia's energy minister, however, was opposing the proposal. Russia is reluctant to agree to such drastic measures in light of the considerable fallout that was caused by the coronavirus in a relatively short period of time. The extent of the ramifications from the coronavirus' global outbreak is still relatively unknown. In essence, there are no solid models in place to project the likely number of people that are going to catch the virus or the exact amount of GDP that is going to be lost when the situation eventually gets settled down. That is why Russia is reluctant to act without having a comprehensive picture of the evolving situation, and would most likely walk out of Austria's capital without agreeing to the terms laid out by Saudi Arabia and the rest of OPEC.
The other members of OPEC and OPEC+ certainly can fulfil the gap left by Russia and thereby meet the desired quota of reductions; however, the apparent disagreements remain the highlight of today’s meeting. The dead-end in negotiations that appears to have been reached today is going to bolster the overarching uncertainty, and likely cause the crude oil prices to continue falling for the next several trading days at least.
3. Short Term Outlook:
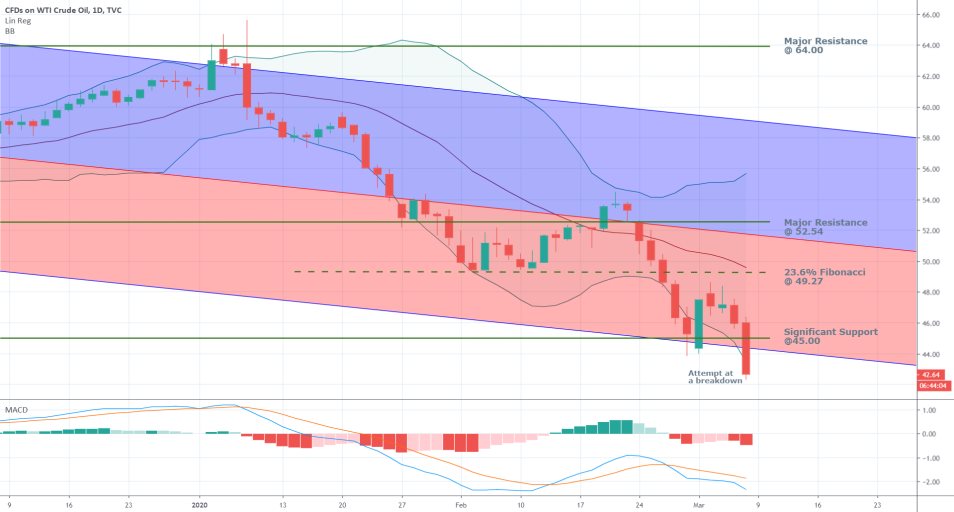
The MACD on the daily chart below is manifesting the strong bearish momentum in the market. The 12-day EMA has recently crossed below the 26-day EMA following a period of moderate advancement, which is quite illustrative of the crushing bearish momentum that continues to be observed in the short run.

As can be seen, the price is currently trading around 42.50 dollars per barrel, as today’s candlestick is breaking down below the lower BB; the significant support level at 45.00; and the lower boundary of the descending channel. All of this is illustrative of the strong bearish sentiment and a likely precursor of the continuation of the downtrend’s development.
If today's trading session closes at the current price level without any pullbacks until the market closes, this will offer excellent opportunities for entering short on Monday's open. As of now, all underlying indications seem to be inlined, and the price is more than likely to continue falling at least to the 40.00, which has psychological importance. This is also the first likely level that can prompt bulls to step up and tip the underlying demand pressures, thereby hindering the continuation of the current bearish downtrend.

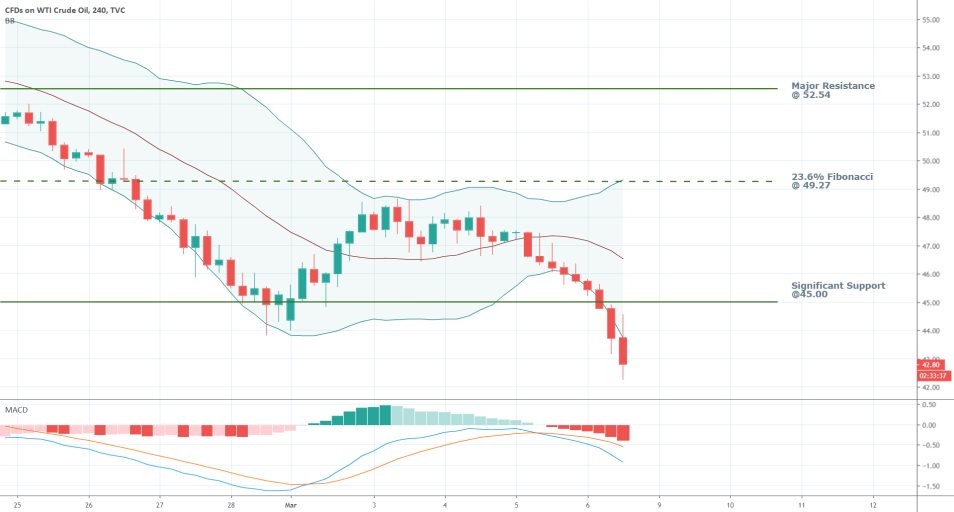
The behaviour of the price action on the 4H chart above is quite telling of the increasing bearish pressure. The size of each subsequent candlestick is bigger than the one preceding it, which means that the downswing is not yet close to being exhausted. Even still, traders should not rush to enter short now (unless they already have open short positions), as a potential pullback is going to wipe out their short orders.
4. Concluding Remarks:
The price action is currently entering uncharted territory – it hasn’t been trading so low for more than two years – which means that the unpredictability factor is quite high. Even though the underlying bearish sentiment is quite evident, traders who look to enter short now might have already missed the big initial opportunity, which would mean that they could face higher risks than possibilities for profiting.
At the current moment, the biggest determinant for the crude oil's price movement are the aforementioned fundamentals, concerning OPEC and Russia. This means that any potential news regarding Russia's involvement in the agreement to cut production could prompt a change in the underlying direction of the price action in an instant. That is why traders should be especially cautious when deciding to implement trend continuation strategies under the current market conditions.
Practising caution and refraining from joining this especially volatile and unpredictable market seems to be the most sensible thing to do, especially for more risk-averse traders.

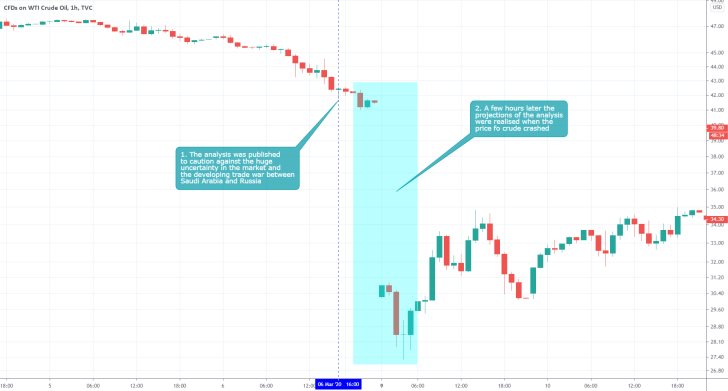
- The analysis did a good job of outlining the adverse impact of the uncertainty resulting from the price war between Saudi Arabia and Russia on the price of crude. More importantly, it emphasised on the dangers of trading at that time, and was justified in advising traders not to place any orders under these volatile conditions on the market. Even though the expectations for further tumbles of the price were ultimately justified, selling crude would have been unadvisable due to the rapidly changing levels of liquidity at that time. Knowing when not to trade is just as important as knowing how to trade.
Disclaimer: Your capital is at risk! Trading and investing on the financial markets carries a significant risk of loss. Each material, shown on this website, is provided for educational purposes only. A perfect, 100% accurate method of analysis does not exist. If you make a decision to trade or invest, based on the information from this website, you will be doing it at your own risk. Under no circumstances is Trendsharks responsible for any capital losses or damages you might suffer, while using the company’s products and services. For more information read our Terms & Conditions and Risk Disclaimer.


