The price of crude oil has been trading in a narrow range over the past several weeks, ever since the energy market started stabilising following the OPEC+ deal for the reduction of aggregate production. But even with the oil price war between Saudi Arabia and Russia now being a thing of the past, the next several months look like they are going to be quite turbulent for the precious commodity.
Firstly, the resurgence of COVID-19 cases globally underlines the real possibility of a second pandemic wave this Fall, which could lead to a new series of lockdowns internationally. As a consequence of such restrictive policies, weakened global demand is quite likely to plummet once again, similarly to what happened in February and March.
Muted global demand is not only bad news for the tentative recovery, but it would also jeopardise the energy market. With low levels of economic activity, the price of crude is likely to start falling once again, even if there are no supply gluts this time.
Meanwhile, the escalating tensions between Greece and Turkey in the Aegean over disputed territory off the coast of a Greek island, poses the very real danger of a new armed conflict in the Mediterranean. Such a regional dispute could quickly evolve into a multinational conflict, which, in turn, could impede trade in the region. Such a turn of events would undoubtedly affect the price of oil as well, due to the fact that clashes in the Aegean could impede all economic interactions in the Mediterranean sector.
The energy market still hasn't started pricing in such turn of events, however, this represents one more reason to analyse the current state of crude oil, which could shed light on its potential future development if the underlying conditions change.
1. Long-Term Outlook:
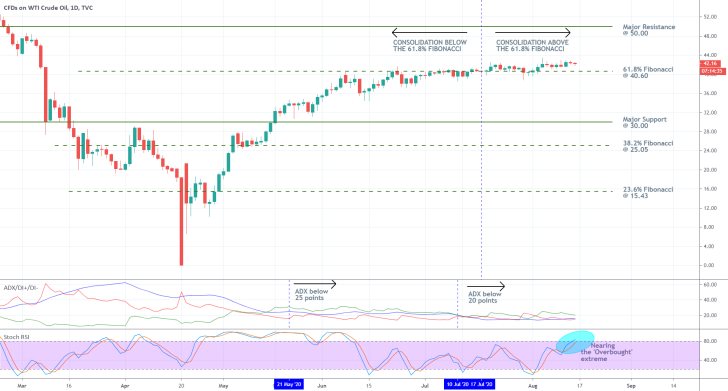
As can be seen on the daily chart below, the price of USOIL has been consolidating around the 61.8 per cent Fibonacci retracement level at 40.60 since early June. The ostensibly range-trading conditions are confirmed by the ADX indicator, which has been threading below the 25-point benchmark since the 21st of May. Moreover, the indicator has been threading below the 20-point mark since the 10th of July. All of this is demonstrative of the very contained price action – contained as in very narrow range – because of which, no sudden changes in the underlying direction of the price action are expected at the present rate.

Meanwhile, the Stochastic RSI indicator is nearing the 'Overbought' extreme, which in itself could incite the bears to step up and place more selling orders. Such actions would be justified, given the aforementioned range-trading conditions. Bears and bulls alike recognise that given the underlying market sentiment, the price action is more than likely to fluctuate between the two extremes. In other words, the longer the RSI threads in the 'Overbought' extreme, the likelier it becomes for a new reversal.
The first logical target level is encapsulated by the 61.8 per cent Fibonacci itself; however, if a second coronavirus wave does indeed diminish the aggregate demand globally, then the next target level would be the major support at 30.00, which has psychological significance due to the three zeroes.
Conversely, if an unexpected escalation of tensions in the Aegean causes the price of crude to surge on investors' fears over the global supply chains, then the precious commodity could rally towards the next psychological resistance at 50.00.
2. Short-Term Outlook:
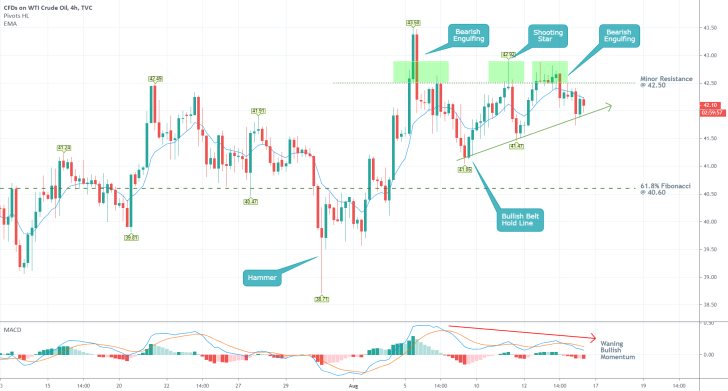
Recently, the price of crude has been consolidating between the minor resistance level at 42.50 and the ascending trend line. The latter was established from the two most recent pivot lows, at 41.05 and 41.47 respectively. A breakout above the resistance or breakdown below the trend line would be demonstrative of the price action's next likely direction over the short run.
Meanwhile, the price action is trading below the 10-day EMA, which is illustrative of rising bearish bias in the market. This is further confirmed by the waning bullish momentum, as demonstrated by the MACD indicator.

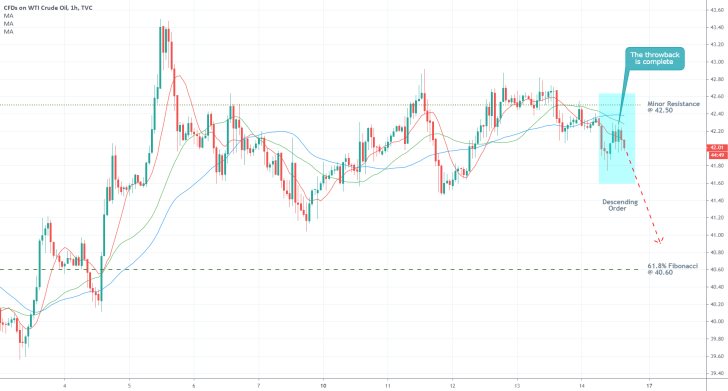
Another piece of evidence of the rapidly rising bearish outlook of the market in the short term can be ascertained from the hourly chart below. As can be seen, over the last several hours, the price action rebounded from the 10-day MA (in red), which is currently trading below the 30-day MA (in greed). The latter is positioned below the 50-day MA (in blue). This descending order of the four is manifesting strong bearish sentiment, which could result in the establishment of a sizable downswing.
For as long as this relationship is maintained, the market bears could expect to see at least one probing attempt of the price action at breaking down below the most recent swing low, and potentially heading towards the 61.8 per cent Fibonacci afterwards.

3. Concluding Remarks:
As regards the long run, crude's price is going to be affected mostly by the way the pandemic develops next. If governments opt to reintroduce stricter containment measures in a bid to ward off the prospects of a second coronavirus wave, then crude oil is likely to tumble as global demand starts to wane once again. Conversely, escalation of the tensions between Turkey and Greece could have the opposite effect if investors perceive once such conflict as posing a significant threat to the regional supply chains.
As regards the short run, there are mounting pieces of evidence signalling the rising bearish sentiment, as the market continues to consolidate in a tight range. This means that the price of crude could fall to the 61.8 per cent Fibonacci retracement level one more time next week.

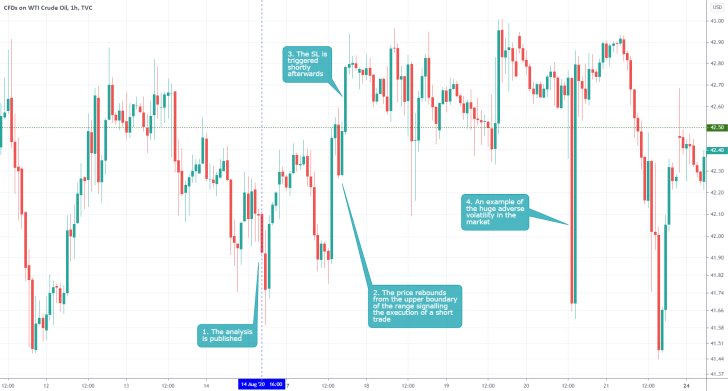
- The short-term projections of the analysis were not realised – the price did not fall to the lower boundary of the range. One of the advantages of the analysis was its recognition of the range-trading conditions in the market. However, it should have stressed on the huge adverse volatility at that time, so that traders could have abstained from trading in this hugely unpredictable environment. Even if the market is ranging, traders should refrain from implementing range-trading strategies if the price action is being driven by huge levels of adverse volatility.
Disclaimer: Your capital is at risk! Trading and investing on the financial markets carries a significant risk of loss. Each material, shown on this website, is provided for educational purposes only. A perfect, 100% accurate method of analysis does not exist. If you make a decision to trade or invest, based on the information from this website, you will be doing it at your own risk. Under no circumstances is Trendsharks responsible for any capital losses or damages you might suffer, while using the company’s products and services. For more information read our Terms & Conditions and Risk Disclaimer.


