The price action of the second most popular cryptocurrency in the world is currently behaving as per the expectations of the Elliott Wave Cycle Theory, amidst the general selloff in the market. This behaviour elucidates the possibility for the implementation of trend-continuation trading strategies. Namely, bulls and bears alike may try to pick tops and bottoms as the Elliott cycle continues to evolve.
Higher-risk assets are losing ground at present because of a bundle of contributing factors. Most of all, the substantial market volatility that is being prompted by the escalating tensions alongside Ukraine's border with Russia is making investors prefer lower-risk securities at present.
The underlying uncertainty is further being bolstered by soaring global inflation, which is why all eyes are currently focused on the pivotal FED meeting for January, which is scheduled to take place tomorrow. Whether or not the FOMC decides to adopt a more hawkish policy stance, the consequences are likely to be significant for the value of the dollar. This, in turn, would likely have a spillover effect on the crypto market as well.
The underlying setup is not suitable for highly risk-averse traders not accustomed to navigating such massive levels of adverse volatility. However, it may also entail some excellent opportunities for picking the tops and bottoms of the underlying downtrend due to the scalability of the price action. The Elliott theory is thus implemented to probe this fractal nature of the price action.
The Scale of the Downtrend
The current downtrend is represented as a descending channel on the daily chart below. Notice that the price action penetrated below the lower limit of the channel in the last several days, which could be a precursor to a subsequent rebound. Particularly given the development of a Hammer candle from the 500-day MA (in purple).
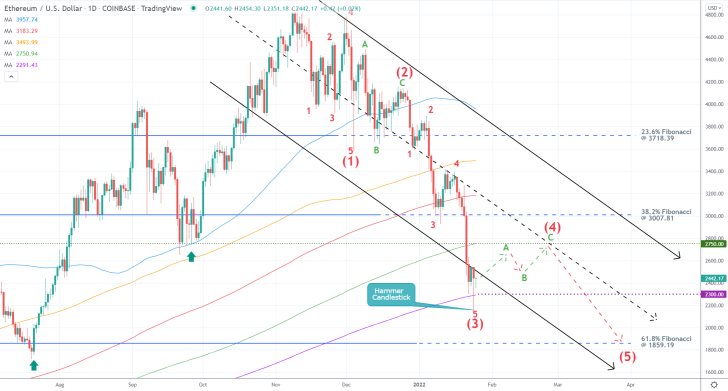
Notice that the downtrend appears to be taking the form of a 1-5 impulse wave pattern, and the latest downswing to the 500-day MA seemingly encompasses its second impulse leg (2-3). The scalability of the price action is elucidated by the fact that the two impulses and one intermediate retracement leg are structured as Elliott patterns themselves.
Hence, the price action is now likely to develop the second retracement leg (3-4), which is probably going to take the form of an ABC correction. This retracement is likely to head towards the major support-turned-resistance level at 2750.00, which is about to converge with the middle line of the descending channel. Moreover, the 2750.00 is presently converging with the 400-day MA (in green), making it an even more prominent resistance level.
Once this second retracement leg (3-4) in the form of an ABC correction is completed, the price action is likely to commence the third and final impulse leg (4-5), which is likely to head towards the 61.8 per cent Fibonacci retracement level at 1859.19.
Charting the ABC Correction
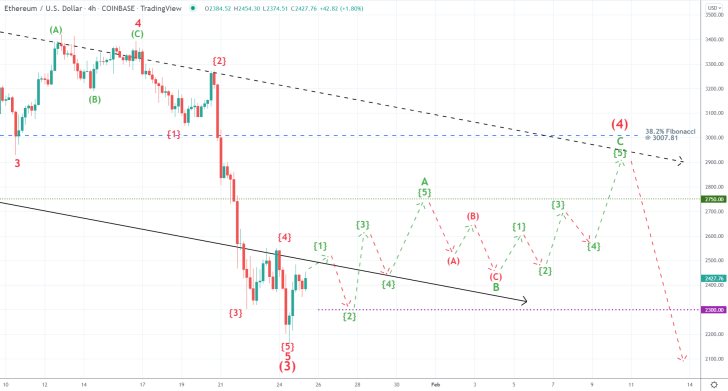
As can be seen on the 4H chart below, the scalability of the price action is evident even on charts with smaller timeframes. Therefore, the ABC correction that is expected to underpin the broader (3-4) retracement leg is also likely to behave as per the expectations of the Elliott Theory.
It follows that the (3-A) leg is probably going to take the shape of a minor 1-5 impulse wave pattern as well. It would probably bounce between the lower limit of the descending channel and the major support level at 2300.00, underpinned by the 500-day MA, before it heads towards the previous swing low at 2750.00.
The (B-C) leg would likely take the form of a 1-5 Elliott pattern as well, while the (A-B) leg would be structured as a minor ABC correction. Bulls and bears can use this insight to position themselves accordingly.
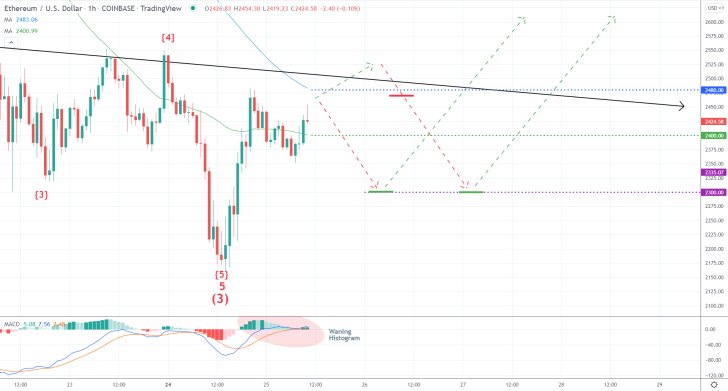
The underlying bullish momentum has been falling gradually over the last several hours, as illustrated by the diminishing histogram of the MACD indicator on the hourly chart below. Meanwhile, the 50-day MA (in green) and 100-day MA (in blue) underscore two crucially important thresholds - the minor support at 2400.00 and minor resistance at 2480.00, respectively.
In relation to the expectations for the formation of a broader (3-4) retracement leg in the shape of an ABC correction, therefore, bulls and bears could attempt two different approaches to trading the underlying setup. The former would benefit more from utilising trend continuation strategies, whereas the latter could implement contrarian trading strategies at the next peak.
Concluding Remarks
As regards the trading opportunity for bulls, they can place long limit orders at 2300.00. Their supporting stop-loss orders should not be placed deeper than $50 below their initial entries. As stated earlier, their target would be the major resistance level at 2750.00. However, once the price action penetrates above the resistance at 2480.00, bulls would be able to move their stop orders to breakeven and implement floating TPs.
Bears, in contrast, can try to enter short around 2470.00, provided that the price action retraces from the 2500.00 threshold first. This would entail a high degree of risk, which is why the opportunity is not suitable for highly risk-averse traders. Bears' stop-loss orders should not exceed $30 from their initial entries. Their target would be the aforementioned support level at 2300.00.
An Ascending Wedge Signifies a Temporary Break in Ethereum's Downtrend
The struggles for Ethereum continue amidst a general turmoil in the crypto market. A temporary break in the underlying downtrend is unfolding at present, though the price action is expected to continue depreciating once the pullback is over.
The reasons for this bearish market are many. Above everything else, investors are shying away from high-risk assets because of rising uncertainty globally. As stated in our other analyses from today, the chief catalyst for this is the situation in Ukraine. Its impact can also be seen in the parallel strengthening of the dollar, as investors seek to hedge their portfolios with lower-risk securities.
Bears may try to take advantage of the pullback by implementing trend-continuation strategies, by selling the eventual peak of the pullback in anticipation of a subsequent dropdown. Bulls, in contrast, could adopt riskier contrarian trading strategies, seeking to ride the current pullback.
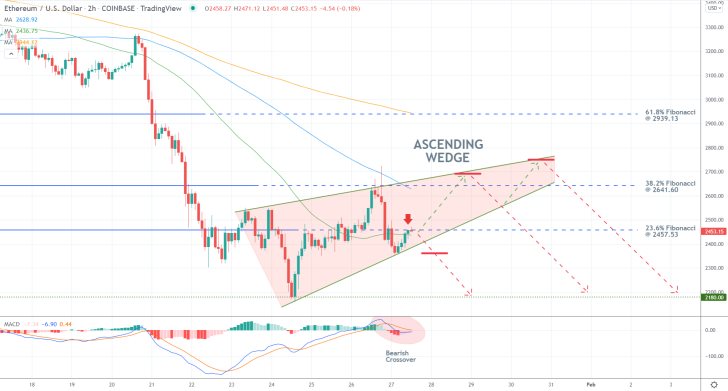
As can be seen on the 2H chart above, Ethereum's pullback is taking the shape of an Ascending Wedge. When found within an established uptrend, this type of pattern typically entails a probable trend continuation.
The pullback is likely to be terminated around the 38.2 per cent Fibonacci retracement level at 2641.60, which is currently converging with the 100-day MA (in blue) and is being crossed by the upper limit of the Wedge. However, a bearish reversal may also emerge from the current spot price.
Notice that the price action is so far unable to break out above the 23.6 per cent Fibonacci at 2457.53 and 50-day MA (in green) decisively. Meanwhile, the recent crossover on the MACD indicator demonstrates a resurgence of bearish momentum.
Bears can, therefore, take advantage of the underlying set-up in one of two ways, depending on their level of risk-aversion. They can either open short market orders just below the 23.6 per cent Fibonacci, or they could place short limit orders at the 38.2 per cent Fibonacci.
In either case, their supporting stop-loss orders should not be placed more than $50 above their initial entry levels. Bears would be looking for a probable dropdown to the previous swing low at 2180.00.
Bearish Correction on Ethereum Currently in the Making
The price action of Ethereum has been establishing a bullish upswing over the last few weeks, and now it looks poised for another minor correction. Bearish pressure on the cryptocurrency is likely to increase in the near future as investors shift their focus on the stock market, which is riding high currently owing to the robust earnings season in the U.S.
The underlying set-up thus looks suitable for the implementation of contrarian trading strategies by bears wanting to take advantage of the correction. Meanwhile, longer-term bulls could seek to utilise trend-continuation trading strategies. Case in point, they could try to buy the eventual dip of the correction, anticipating the probable continuation of the underlying uptrend further up north.
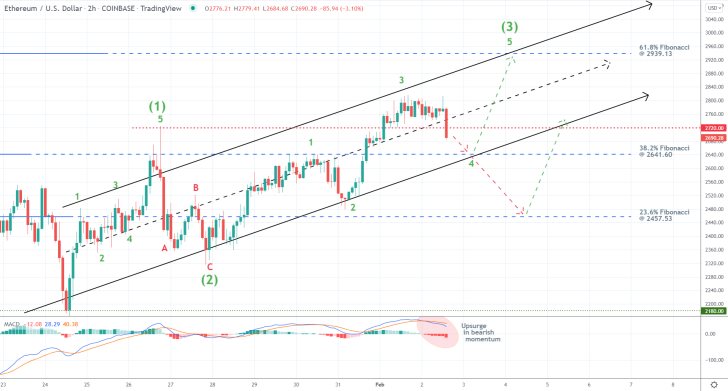
As can be seen on the 2H chart above, the uptrend is represented as an ascending channel. Moreover, it appears to be taking the form of a 1-5 impulse wave pattern, as postulated by the Elliott Wave theory. Due to the fractal nature of the price action, the current correction appears to be functioning as the second minor retracement leg (3-4) within a broader impulse leg (2-3).
What is noteworthy is that the presently unfolding breakdown, which is likely to signify the beginning of the correction, is so far managing to penetrate below the resistance-turned-support level at 2720.00 and the middle line of the channel. Meanwhile, the parallel crossover on the MACD indicator demonstrates an uptick in bearish momentum.
Bears can try to enter short around the current spot price (2675.00), though their supporting stop-loss orders should be placed no higher than 2720.00. Once the price action falls below the 38.2 per cent Fibonacci retracement level at 2641.60, bears would be able to move their stop orders to breakeven or implement floating TPs. Their ultimate goal would be the 23.6 per cent Fibonacci at 2457.53.
Bulls, in turn, should consider entering long around the 38.2 per cent Fibonacci on the condition that the price action fails to break down below it in the next 10-20 hours. Alternatively, they can place long limit orders at the 23.6 per cent Fibonacci. In either case, their supporting stop-losses should not be placed lower than $50 below their initial entries.
Bulls would be able to collect their profits at the 61.8 per cent Fibonacci at 2939.13, which is positioned just below the psychologically significant threshold at 13000.00.
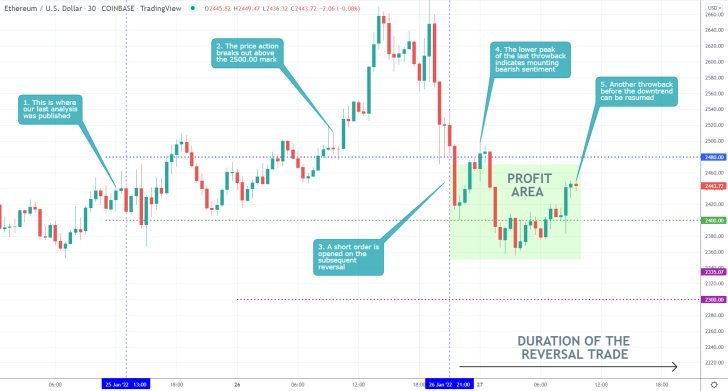
- Despite some adverse fluctuations, the expectations of our last Ethereum analysis are slowly starting to be realised. Following the initial breakout above 2500.00, the subsequent reversal triggered a short limit order at 2470.00.
- The consecutively lower swing peaks indicate rising bearish sentiment.
- The next target for the new downtrend remains, as stated in the primary analysis, the 2300.00 mark.
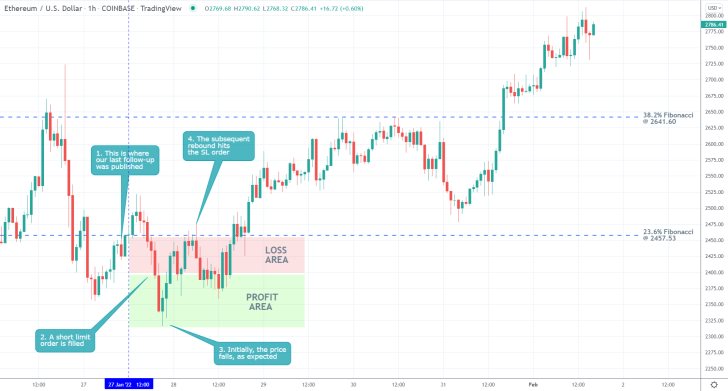
- The expectations of our last follow-up on Ethereum were not realised. Even though the price action fell shortly after its release, enough to trigger the execution of a short limit order, the subsequent rebound promptly triggered the stop-loss order.
- Such adverse fluctuations are the most common threat to the precision of a trader's order execution. However, traders should not allow their frustration to cloud their future judgement.
- Remember, trading is not a sprint; it is a marathon, which implies the occasional hiccup along the way to success.
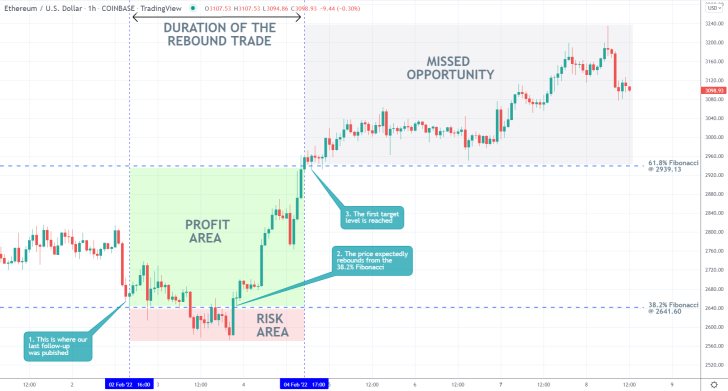
- The expectations of our last analysis of Ethereum were fulfilled. The price action did rebound from the 38.2 per cent Fibonacci retracement level at 2641.60 and went on to reach the target level at the 61.8 per cent Fibonacci.
- However, the upswing went on to break out even higher, which was not capitalised on by the trade.
- Premature exits out of trades could lead to such substantial missed opportunities.
Disclaimer: Your capital is at risk! Trading and investing on the financial markets carries a significant risk of loss. Each material, shown on this website, is provided for educational purposes only. A perfect, 100% accurate method of analysis does not exist. If you make a decision to trade or invest, based on the information from this website, you will be doing it at your own risk. Under no circumstances is Trendsharks responsible for any capital losses or damages you might suffer, while using the company’s products and services. For more information read our Terms & Conditions and Risk Disclaimer.


