Bullish bias on the EURUSD increased marginally last week following the publication of the latest inflation numbers in the U.S. The dollar weakened temporarily because headline inflation remained flat at 5.4 per cent from a month prior. However, the prevailing market sentiment remains ostensibly bearish-oriented.
The greenback is likely to strengthen this week on the U.S. retail sales data, which is scheduled for publication tomorrow. Meanwhile, there aren't a lot of events in the economic calendar that could support the recuperation of the euro.
The underlying fundamental setup thus looks suitable for the implementation of trend continuation trading strategies. In particular, bears can look for an opportunity to sell at the peak of the current bullish pullback in anticipation of the continuation of the development of the broader downtrend.
Examining the descending channel
As of late, the underlying bearish trend has been contained within the boundaries of the descending channel, as can be seen on the daily chart below. For the most part, the price action has been behaving as per the expectations of the Wyckoff Cycle Theory.
Notice that last week's bullish pullback, which emerged following the U.S. CPI numbers' release, is also a rebound from the channel's lower boundary. In addition to this rebound from the channel, the price action also bounced off from the lower limit of the last Re-Accumulation range at 1.17000.
Seeing as how this was the first test of this major threshold, the subsequent development of a bullish pullback is not at all that surprising. That is why the broader Markdown is expected to persist and eventually break down below the lower border of the last Re-Accumulation range.
This is substantiated by the fact that the Markdown takes the form of a massive 1-5 impulse wave pattern, as postulated by the Elliott Wave Theory. The current pullback thus represents a minor adverse fluctuation within the broader 1-5 impulse leg. Consequently, bears can take advantage of this by selling at the next swing peak before the price action gets ready to resume falling.
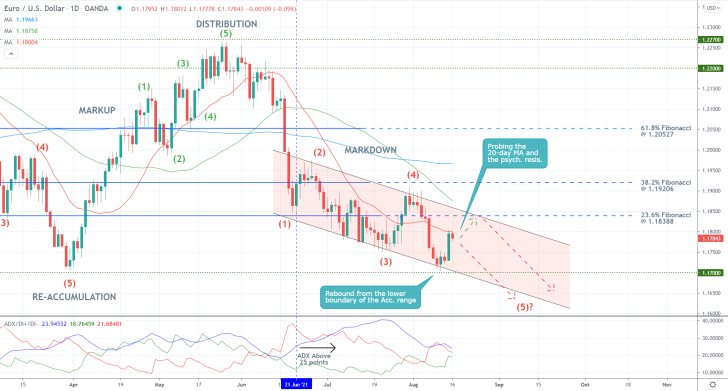
The ADX indicator has been threading above the 25-pint threshold since the 21st of June, which confirms that the EURUSD is indeed trending. Under these conditions, the market is unlikely to establish decisive reversals in an instance, which is why last week's pullback is unlikely to terminate the Markdown.
The price action just reached the psychologically significant resistance level at 1.18000, which in itself represents a significant turning point. The latter is also converging with the 20-day MA (in red), which serves as a floating resistance. These two factors signify a very probable reversal from the current spot price.
However, fakeouts above 1.18000 and the 20-day MA are also possible. The price action could potentially climb to the 23.6 per cent Fibonacci retracement level at 1.18388, which represents yet another threshold with psychological importance before a decisive reversal takes place.
The significance of the 23.6 per cent Fibonacci is furthered bolstered by the fact that it is about to be crossed by the 50-day MA (in green).
Minding the Elliott impulses and retracements
The prevalence of the Elliott Wave method becomes more evident in the short term. As can be seen on the 4H chart below, each of the separate legs of the broader 1-5 pattern mentioned above takes the form of a minor Elliott structure itself. The 2-3 impulse leg is thus structured as a 1-5 impulse wave pattern, whereas the 3-4 retracement leg resembles a corrective ABC pattern.
It follows that the latest pullback that emerged from the lower end of the Re-Accumulation range serves as a minor retracement leg (1-2). This in itself confirms the expectations for a forthcoming bearish reversal.
In addition to the aforementioned reasons, such a reversal is also likely to occur around the current spot price because of the fact that the price action appears unable to break out above the 100-day MA (in blue) for the time being.
Additionally, the pullback is starting to look more and more like a Dead Cat Bounce pattern, which typically signifies likely bearish reversals.
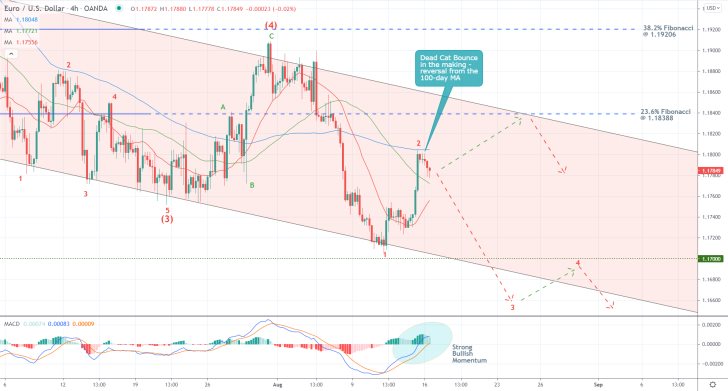
Nevertheless, the underlying momentum presently remains ostensibly bullish-oriented, as underpinned by the MACD indicator. That is why bears should be mindful of a potential pullback continuation towards the 23.6 per cent Fibonacci before a decisive reversal occurs.
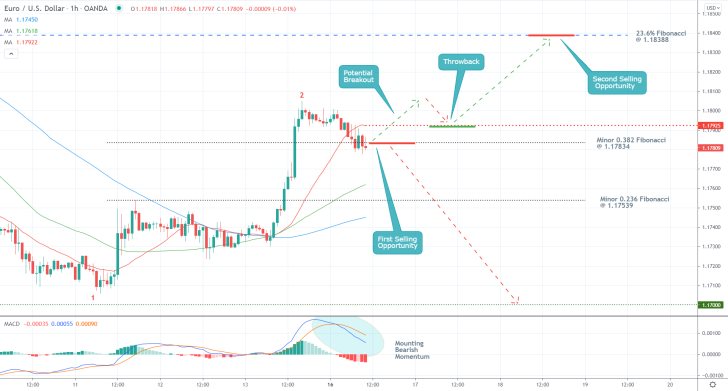
The underlying outlook differs only slightly on the hourly chart below. Chiefly, the MACD demonstrates rising bearish momentum, which started happening following today's market open.
The price action is currently consolidating below the 20-day MA, which underpins the closest minor resistance, and the 0.382 Fibonacci threshold (as measured against the last downswing) at 1.17834.
Concluding remarks
Bears can look for an opportunity to sell around the current spot price for as long as the price action remains concentrated below the minor 0.382 Fibonacci. They can place their stop-loss orders just above the minor resistance at 1.17925.
Once the price action breaks down below the Re-Accumulation range's lower boundary at 1.17000, which also bears psychological significance, bears can substitute their fixed stop orders with floating TPs in order to squeeze the maximum out of the subsequent dropdown into uncharted territory.
Bulls, in contrast, can go long, provided that the price action establishes a decisive breakout above 1.17925 in the short term. They would be trading on the expectations for the continuation of the pullback towards the 23.6 per cent Fibonacci retracement level at 1.18388.
Parallel to the risk-management logic of bears, bulls should not place stop-loss orders that exceed the minor 0.382 Fibonacci at 1.17834.
Once the price reaches 1.18388, bears would then have another opportunity to enter short.
Where to Next for the EURUSD Pair?
Earlier today, the price action of the EURUSD reached the psychologically significant support level at 1.170000 - a level that was last reached in March 2021. This swing low represents a major threshold, which means that if the price manages to consolidate below it decisively, this would confirm the existence of very strong selling pressure.
However, if it bounces back above 1.17000, this would imply the likely emergence of a temporary pullback. That is why traders would observe carefully the behaviour of the price action around this psychological turning point in the very short term.
It is important to point out that the latest dropdown was prompted by the July FOMC Minutes, which signalled investors' expectations of a likely FED tapering by the beginning of 2022. The dollar continues to benefit from this, which is why EURUSD bulls should keep in mind that going against the trend at the present moment would entail a significant degree of risk.
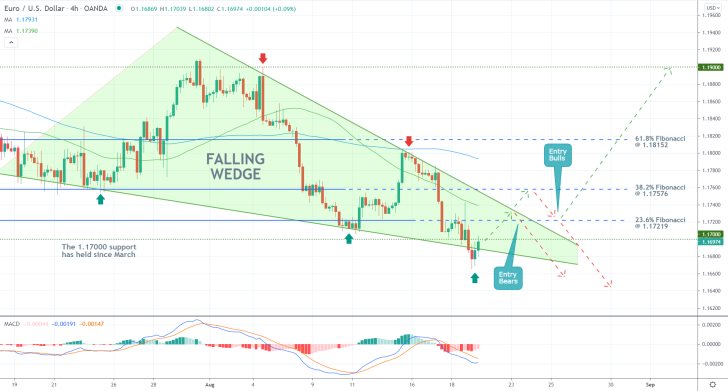
As can be seen on the 4H chart above, the price action appears to be developing a Falling Wedge pattern, which typically signifies a probable bullish rebound in the making. However, this piece of evidence alone is not substantial enough to warrant the execution of a long order around the current spot price.
Bulls can consider entering the market only on the condition that the price action breaks out above the upper boundary of the Wedge decisively. Such a breakout to the 38.2 per cent Fibonacci retracement level at 1.17576 is then likely to be followed by a throwback to the 23.6 per cent Fibonacci at 1.17219.
This is where bulls can place their buying orders on the expectation of a trend reversal. Notice that such a turn of events would represent the emergence of an Inverted Head and Shoulders pattern, confirming the bullish expectations.
The 61.8 per cent Fibonacci at 1.18152 roughly outlines the neckline of the pattern. A breakout above it would allow for the extension of the uptrend towards the psychologically significant resistance at 1.19000.
However, should the price action reverse from the upper limit of the Wedge and then get back below the 23.6 per cent Fibonacci and the swing low at 1.17000, this would allow bears to add to their selling orders.
They can utilise floating take-profit orders right from the get-go in order to squeeze the maximum out of the subsequent downtrend into uncharted territory.
EURUSD's Descending Channel Persists
The price action of the EURUSD currency pair has been affected by the recent depreciation of the dollar, similarly to other assets. The greenback has been retreating this week following the massive gains it generated over the past five days.
However, the newest corrective movement on the EURUSD is not enough to invalidate the persisting bearish bias in the market, which is why the price action is likely to resume heading lower shortly.
As was consistently argued in our last trading analyses, the likely catalyst for the next dollar rally would be the upcoming speech of FED Chair Jerome Powell this Friday. He is scheduled to speak at the Jackson Hole symposium and expound upon the recent talks of a potential FED tapering by early 2021.
EURUSD's pullback is thus likely coming to an end, which seems like a good time for bears to consider utilising trend continuation trading strategies. Chiefly, they can look for an opportunity to sell around the recent peak in anticipation of another major dropdown.
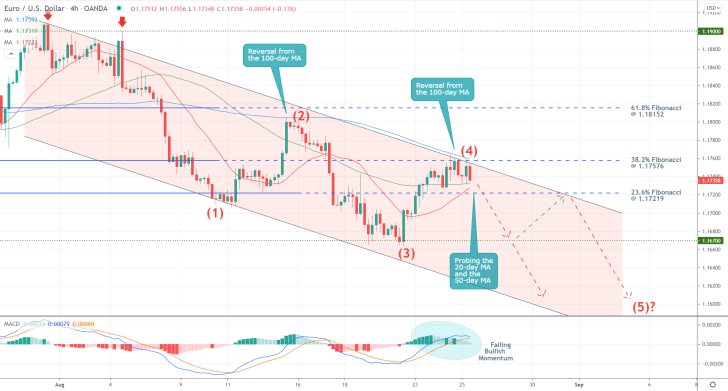
As can be seen on the 4H chart above, such a peak appears to have been completed at the upper boundary of the descending channel. Moreover, the price action remains concentrated below the major support-turned-resistance at the 38.2 per cent Fibonacci retracement level. Both of these factors seem to suggest a likely bearish reversal currently in the making.
The descending channel, which highlights the development of the underlying downtrend so far, also seems to pinpoint the existence of a 1-2 impulse wave pattern, as postulated by the Elliott Wave Theory. The recent pullback serves as the second retracement leg of the pattern (3-4), which implies the likely emergence of the final impulse leg (4-5) next.
The reversal is made even more likely by the fact that the 100-day MA (in blue) is currently converging with the 38.2 per cent Fibonacci retracement level. At the same time, the diminishing histogram of the MACD indicator illustrates waning bullish momentum.
Bears can look for an opportunity to sell around the current spot price, placing a tight stop-loss order no more than 30 pips away from the 100-day MA. However, they should be mindful of potential adverse fluctuations from the 23.6 per cent Fibonacci at 1.17219. This is bolstered by the fact that both the 50-day MA (in green) and the 20-day MA (in red) have crossed above this threshold.
The first major target for bears is underpinned by the latest swing low (point 3) at 1.16700. Keep in mind that a minor pullback to the 23.6 per cent Fibonacci could emerge from this support.
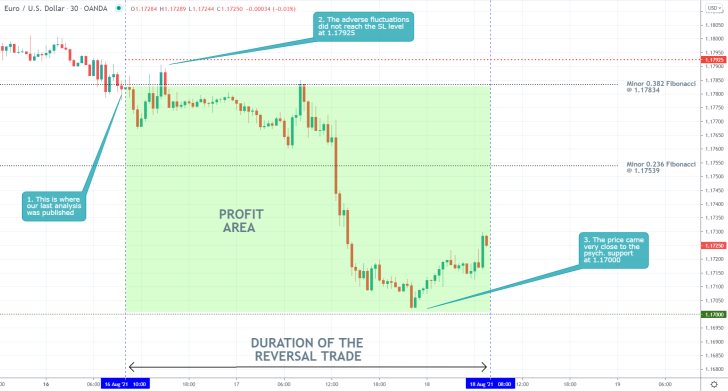
- The price of the EURUSD started depreciating shortly after the publication of our last analysis of the pair, as expected. Despite some initial adverse fluctuations, the price did not reach the SL just above 1.17925.
- The risk management of the trade was excellent because the SL was positioned maximally close to the entry without it being jeopardized by random fluctuations. This ensured minimum risk and maximum potential reward.
- It is worth pointing out that the price rebounded just above the major support at 1.17000. This is a good reminder that the price action tends to change directions promptly around levels of psychological importance.
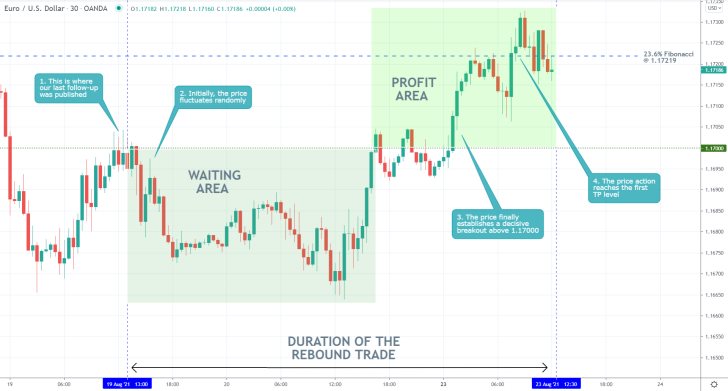
- Despite some initial tribulations, the price action of the EURUSD started appreciating recently, as expected by our latest follow-up analysis of the pair. The price action reached the first TP level underpinned by the 23.6 per cent Fibonacci retracement level at 1.17219.
- However, seeing as how the price action had to first fall by 30 pips in the opposite direction unless it reaches the second target (the 38.2 per cent Fibonacci), the trade wouldn't have been warranted.
- That is so because so far, the risk to reward ratio is 1:1.
- Generally speaking, even if your position is ultimately profitable, unless it's risk to reward ratio does not exceed at least 1:2, the trade should be considered as being too risky.
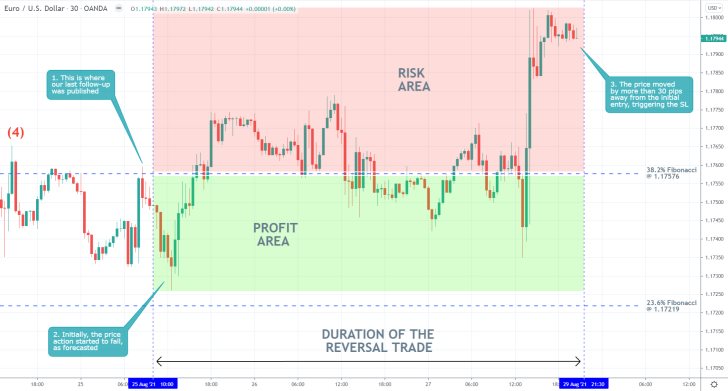
- The EURUSD pair did not establish a decisive bearish reversal from the 38.2 per cent Fibonacci retracement level at 1.17576 following the release of our previous analysis of the pair.
- Shortly after its publication, there was some initial success as the price action came close to the 23.6 per cent Fibonacci. However, a subsequent rebound triggered the stop-loss order, which was placed 30 pips away from the initial entry.
- This is why when practising contrarian trading, it is especially important to place narrow stop orders in order to protect yourself against sudden changes in the direction of the price action.
Disclaimer: Your capital is at risk! Trading and investing on the financial markets carries a significant risk of loss. Each material, shown on this website, is provided for educational purposes only. A perfect, 100% accurate method of analysis does not exist. If you make a decision to trade or invest, based on the information from this website, you will be doing it at your own risk. Under no circumstances is Trendsharks responsible for any capital losses or damages you might suffer, while using the company’s products and services. For more information read our Terms & Conditions and Risk Disclaimer.


