The currencies of top economies in the East Pacific region, notably those of New Zealand and Australia, were already put under much strain in the months leading up to the global coronavirus outbreak for a number of reasons. Chiefly, the geopolitical landscape in the region was such that the previously escalating trade war between the US and China was exacerbating the trade difficulties for New Zealand and Australia, which rely heavily on their partnerships with the two biggest economies in the world.
Consequently, the Kiwi and the Aussie were becoming significantly undervalued compared to the greenback in the last weeks of 2019, as the strained negotiations between Washington and Beijing were reaching a peak. This process was then drastically amplified when COVID-19 became a pandemic, leading to the disruptions of global supply chains, and impeding the general economic activities worldwide.
At the height of the market rout caused by the coronavirus fallout in the middle of March, the NZDUSD fell to the historical low of 0.54700. The last time this level was reached was in the aftermath of the credit crunch in 2009, which underscores the severity of the current situation for the Kiwi. The drop was additionally intensified by the heightened demand for the US dollar globally, due to its status as a safe-haven currency at times of financial crisis and general market uncertainty.
Then came the massive amounts of liquidity pumped into the global economy by central banks everywhere, which mitigated the size of the economic hit and supported the reeling markets at the time when they most needed such help. The Reserve Bank of New Zealand made no exception, and it too lowered its interest rate at the height of the coronavirus crisis.
The bolstered money supply is likely to impede the strength of the Kiwi in the long run by diminishing its competitiveness. However, in the short term, it had the desired effect of ensuring the stabilisation of the financial system in New Zealand. The increased liquidity in the country assured the continuation of the financial market's operations in a time of global crisis, which was received by investors and other market participants as welcoming news. This, in turn, is why the Kiwi strengthened by the end of March, and throughout April.
However, the NZDUSD's bullish correction appears to have reached a new roadblock, and the pair is currently struggling to break out above the major resistance level at 0.60800. The price action is consolidating below this significant barrier, and some traders have started to question whether the NZDUSD has the strength to continue heading further north, or the bullish sentiment is all but exhausted, and the market might be due for a new bearish downswing.
That is why the purpose of today's analysis is to examine the behaviour of the price action at present, and to determine what the mid-term tendencies are most likely to be.
1. Long Term Outlook:
The first major observation regarding the behaviour of NZDUSD's price action that can be drawn from examining the weekly chart below is that by bouncing up from the significant support level at 0.57000 in mid-March, the pair finished establishing a major 1-5 impulse wave pattern. Firstly, this indicates the conclusion of the previously bearish market (at least temporarily) and signals the reversal of the underlying price action's direction – the formation of the current bullish correction. Secondly, the exhaustion of the bearish 1-5 impulse wave pattern on the weekly chart could be an early indication for the transition of the NZDUSD into a new bullish market, which, however, would develop in the long term.
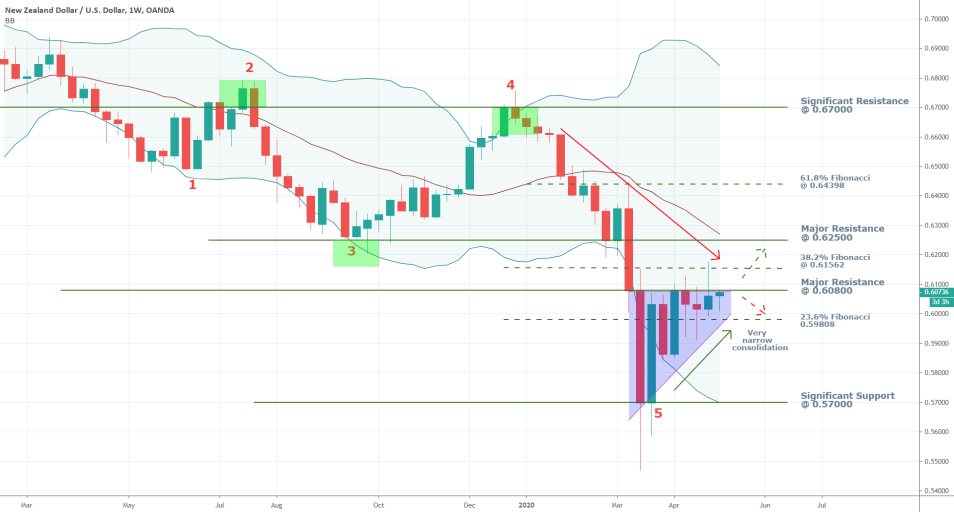
The price action has then proceeded to establish the bullish correction, which has so far been consolidating just below the major resistance level at 0.60800 for seven consecutive weeks. At the same time, the price action is contained above the major support level represented by the 23.6 per cent Fibonacci retracement at 0.59808. This illustrates the increasingly narrower range within which the price action continues to be contained.
The indirect consequence of this is the formation of a 'bottleneck' effect, which underscores the temporary balance that has been reached between the selling and buying pressures in the market. This leads to the subdued price action that is presently seen, which is devoid of considerable fluctuations in either direction. Because of all of this, some traders have started to expect a significant breakout or breakdown to form outside the limits of the underlying range shortly, followed by the formation of a new and decisive directional trend in either direction. The marginal tightening of the Bollinger Bands confirms this assertion of muted market commitment.
If the price action manages to form a decisive breakdown below the 23.6 per cent Fibonacci retracement at 0.59808 and the support there, then the next target for such a newly developing bearish trend would once again be the significant support level at 0.57000. Alternatively, if the price action manages to break out above the major resistance at 0.60800 finally, then the next two targets for such a newly advancing bullish trend would be the 38.2 per cent Fibonacci retracement level at 0.61562, followed by the next major resistance level at 0.62500.
2. The Importance of Labour Data:
As regards the fundamental analysis of the pair, this week's employment data in New Zealand and the US is going to be the most significant determinant for the future sentiment of the underlying market pressures. These employment numbers could potentially serve as a catalyst for the termination of the aforementioned 'bottleneck' in the short run, and the subsequent formation of a new breakout/breakdown. That is why yesterday's unemployment data in New Zealand and tomorrow's Non-Farm Payrolls in the US take the limelight in our fundamental analysis:
- Employment Conditions in New Zealand. We covered Statistics New Zealand's most recent labour force survey in our 'Market Update' from yesterday, in which it was revealed that the unemployment rate in New Zealand has risen at a slower pace than previously expected. This means that the initial adverse impact of the coronavirus fallout on the country's labour market is lesser than previously feared, which is welcoming news. Nevertheless, the headwinds for New Zealand's labour market appear to be just starting.
Another welcoming indication from yesterday's report was the discovery that a positive employment change has been recorded in the first fiscal quarter of 2020, thereby delivering much better-than-expected results.
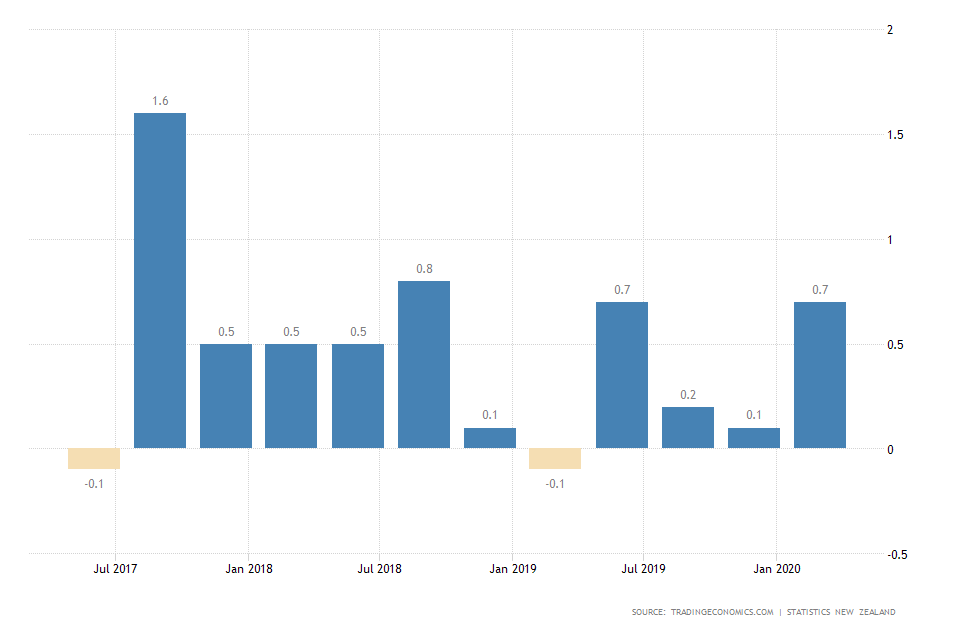
The consensus forecasts were projecting a contraction of 0.2 per cent in the overall employment, following Q4 of 2019's marginal expansion of the labour market by 0.1 per cent. Instead, a positive employment change of 0.7 per cent was recorded, which means that the coronavirus crisis did not impede the labour market in New Zealand in terms of newly opened positions.
Overall, more new jobs were created over the past three months than it was initially anticipated, however, the rate at which people were laid off was higher, which means that the labour market is worse-off. Nevertheless, the observed distortions were lesser than initially thought, which is welcoming news for the NZD. The Kiwi is unlikely to be bolstered significantly by the marked expansion of headline employment, but at least the potential hit has been somewhat mitigated.
- The Non-Farm Payrolls Report in the US. The bureau of Labor Statistics in the States is scheduled to release its monthly jobs report tomorrow, which many market experts expect to deliver the first comprehensive data reflecting on the initial impact of the coronavirus fallout on the American labour market.
According to the consensus forecasts, the NFP for April will demonstrate a drastic surge in headline unemployment by 11.6 per cent to 16.0 per cent. These projections are compiled based on the weekly unemployment claims in the US, which have demonstrated that over 30 million people have filed for state benefits since the coronavirus crisis began over six weeks ago.
While the market has mostly started to discount these deteriorations in the labour conditions, Friday's report reflecting on the headline unemployment in the US is bound to pressure the US dollar, as investors receive these final numbers.
Nevertheless, tomorrow's NFP report is also likely to demonstrate huge discrepancies between the initial estimations and final results. That is so because unlike other times, in this particular situation the labour conditions are changing significantly quite often. This, in turn, makes the task of projecting the true extent of the economic hit on the US labour market quite difficult. Consequently, tomorrow's findings could vary drastically compared to the consensus forecasts, which entails massive fluctuations on all USD pairs, including the NZDUSD.
3. Short Term Outlook:
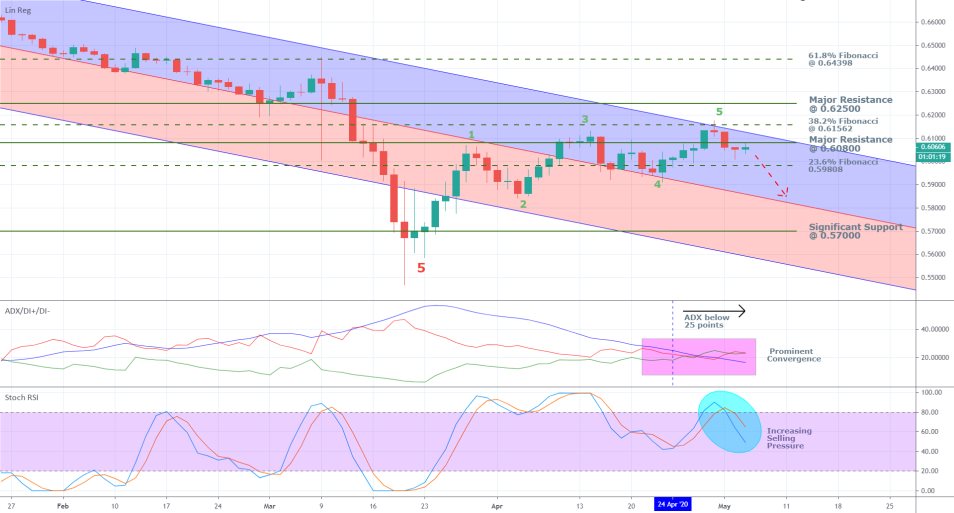
As can be seen on the daily chart above, the price action has reached the upper boundary of a downwards sloping regression channel. This seems to favour a likely trend reversal, and the formation of a subsequent downswing. If this were to happen, then the price action could find support on the channel's middle line.
The ADX is threading way below 25 points, which notably indicates that the market currently finds itself in a range-trading environment. This behaviour is commonly associated with likely reversals of the underlying price action's direction when it reaches the edges of a prominent range, which seems to be the case now. Nevertheless, the ADX is also forming a substantial convergence between it, the DI+ and the DI-. Such behaviour, in turn, is associated with the likely formation of a decisive breakout/breakdown outside the boundaries of an existing range, which is in lined with the previous assertions.
Finally, the Stochastic RSI demonstrates the increasing selling pressure in the market, shown by the indicator's falling value.
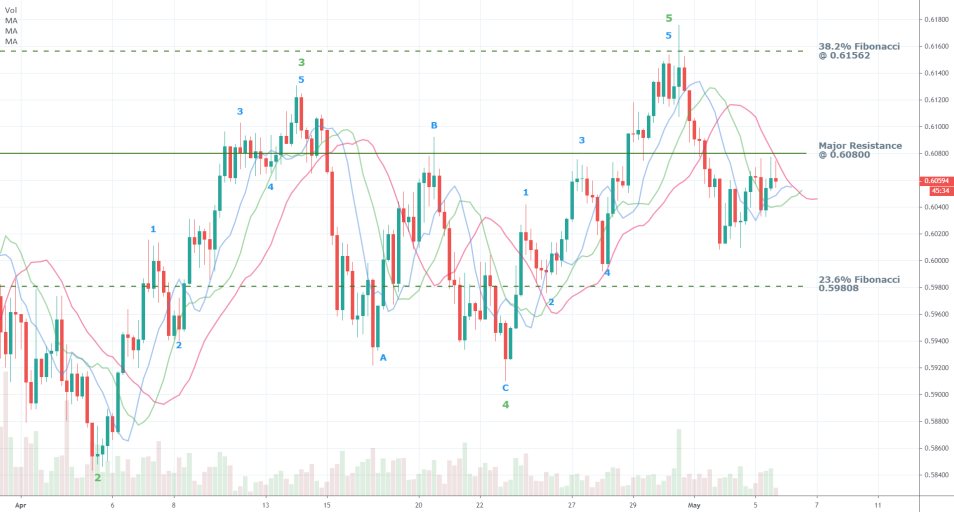
On the 4H chart below can be seen that the price action has recently finished establishing a prominent 1-5 impulse wave pattern (in green), as well as a minor 1-5 impulse wave pattern (in blue). The end of this super cycle indicates the termination of the recent bullish sentiment in the market. This does not necessarily mean that the price action would be unable to sustain future gains further north, however, it remains to be seen whether the price action would continue heading higher, or a new bearish correction will soon follow.
The relationship of the three Moving Averages to each other (5-day MA; 8-day MA, and 13-day MA) highlights the prevailing bearish momentum in the short run. In contrast, the currently transacted trading volume remains quite low, which puts in doubt the formation of any significant downswings in the immediate future.
4. Concluding Remarks:
As regards the underlying fundamentals, the Kiwi seems to have a slight advantage over the greenback in the short term, however, the longer-term outlook of the NZDUSD remains quite subdued.
The technical analysis seems to reveal that the underlying price action is currently consolidating in a narrow range just below the major resistance level at 0.60800. Depending on whether the NZDUSD manages to break out above it, or the price action reverts its direction yet again, would elucidate the next most likely behaviour of the pair in the midterm.
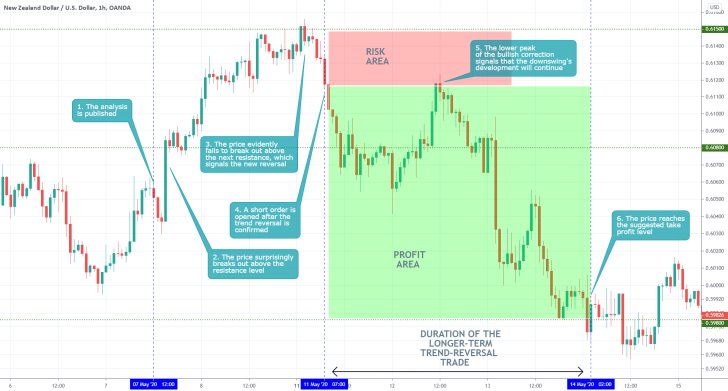
- The prevailingly bullish fundamentals at the time of publication were underpinned by the analysis, and yet, the breakout above the resistance at 0.60800 came in as a bit of a surprise. The price action was indeed concentrated within the suggested levels of support and resistance, however, the direction of the price swings was not highlighted properly.
Disclaimer: Your capital is at risk! Trading and investing on the financial markets carries a significant risk of loss. Each material, shown on this website, is provided for educational purposes only. A perfect, 100% accurate method of analysis does not exist. If you make a decision to trade or invest, based on the information from this website, you will be doing it at your own risk. Under no circumstances is Trendsharks responsible for any capital losses or damages you might suffer, while using the company’s products and services. For more information read our Terms & Conditions and Risk Disclaimer.


