The price of crude oil took a severe hit over the past several weeks as a result of the brewing price war between Russia and Saudi Arabia. The two countries have been boosting their production capacities in a bid to come on top of each other, which has led to the creation of a significant glut in the aggregate output globally.
While the net supply of global crude oil has been exponentially rising over the course of the price war’s escalation, the aggregate demand has been steadily falling since the beginning of the COVID-19 outbreak in China. This has been the result of the inhibited industrial and economic activity globally ever since governments worldwide started recognising the threat from the coronavirus pandemic.
Many countries since then have opted to close down their borders, restrict non-essential travel and have virtually put their economies on lockdown in a bid to curtail the spread of the pathogen among the general population. Due to such restrictions and the implementation of the so-called "Social Distancing" strategy in the fight against the outbreak, the aggregate economic activity has been thwarted in China and elsewhere.
As a consequence, the demand for oil has also plummeted, on the weak industrial demand for the commodity, parallel to the continually rising aggregate supply. The situation has resulted in a strikingly uneven market, with substantial discrepancies between the underlying supply and demand pressures. This disequilibrium has prompted a nearly 70 per cent selloff in the price of crude over the course of just four weeks.
In the last two trading days, however, crude has been able to bounce back with almost 10 per cent following Donald Trump’s remarks from yesterday. The President's pledge to intervene in the price war and act as a mediator between Russia and Saudi Arabia have prompted a temporary jump in the price of the liquid gold, as investors have started to weigh in on the potential normalisation of the supply and demand equilibrium in the market.
The price currently finds itself below the first major obstacle – a prominent resistance level – and its behaviour around it is going to shed more light on the likely development of crude's price in the foreseeable future. That is why the present analysis delves into the fundamental and technical aspects of the crude oil market and investigates whether the price is going to manage to continue its recent bullish correction, or the long-term bearish trend is going to prevail at the end.
1. Long Term Outlook:
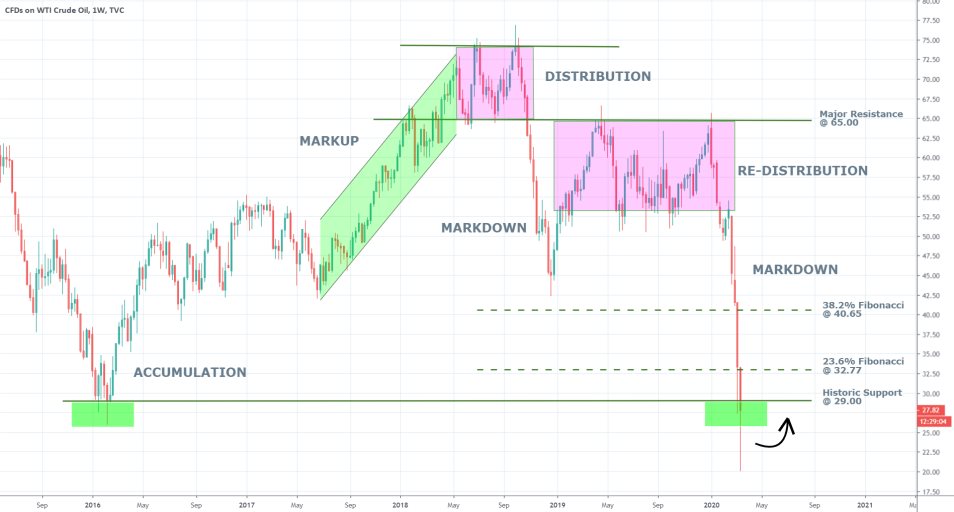
As can be seen on the weekly chart below, crude oil is currently threading around the historic support level at 29.00. Early on this week, the price temporarily dropped to as low as 20.08 dollars per barrel, which level was last reached in February of 2002.
The price then quickly bounced back up, and now the breakdown looks much less decisive, with the current market price trading at 25.09. Even though the psychologically important level at 30 dollars per barrel is now decidedly broken, the historic support level at 29.00 should not be dismissed as of yet, even though the difference between the two is just one dollar. There is still a possibility for the formation of a quick pullback above the support, which would make this week's breakdown a false one.

Apart from its historic significance, the importance of the support at 29.00 is also boosted by its role as a lower boundary of the previous Accumulation range. Because of that, if there is one place where any further losses can be averted, it would be around that support level.
If the bullish correction resumes at the beginning of the next trading week, its first major test on the weekly chart would be the 23.6 per cent Fibonacci retracement level at 32.77.
2. The Underlying Fundamentals and Trump’s Pledge to Intervene:
As regards the nature of the price war, Russia and Saudi Arabia began trumping each other after they failed to reach a mutually satisfying agreement on the appropriate oil production, in light of the coronavirus pandemic, at the 178th OPEC meeting in Vienna.
Hence, for as long as the global economic activity remains subdued, due to the quarantines imposed by many governments, and the two leading producers continue to increase their output capacities, the aggregate supply of oil internationally is going to continue being excessive. This, in turn, would continue to weigh down on the price of the precious commodity.
However, there are some prominent developments in the demand-side spectrum, which could support a hike in the underlying price. Earlier today, Bloomberg media released information, according to which, as of last week as much as 85 per cent of the Chinese economy was back to work.
Over the past two days, China has reported no new coronavirus cases, which has prompted the local authorities to continue easing off the regime in the country. As Chinese workers now return to their workplaces, the country's aggregate output can also be anticipated to start normalising. Consequently, China's demand for crude oil would also likely jump, which is going to affect the rising price of the commodity positively.
Trump's remarks from yesterday could also support a potential rally in the price of crude. When asked about the ongoing price war between Russia and Saudi Arabia, the President said that he would intervene when the time is right.
Even though he did not sound quite decisive in his remarks, his pledge was enough to prompt the short-term jump in the underlying price. Overall, the broader fundamentals – the ongoing price war - seem to support the continuation of the muted pressures in the market. However, the recent developments in the short-term are more favourable for the formation of a new bullish correction.
3. Short Term Outlook:
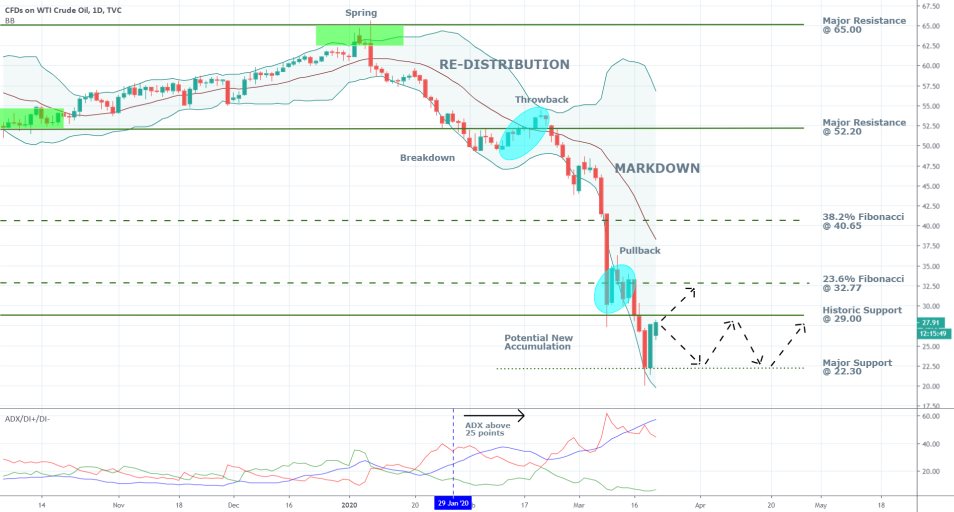
The prevailing bearish trend continues to be quite robust, as illustrated by the ADX, which is currently threading way above 25 index points. Solely based on the underlying market sentiment and the strength of the markdown, it could be asserted that the recent pullback is more likely to turn out to be a short-term correction as opposed to the initial stage in a new trend reversal.

If, however, the recent fundamental developments prove out to be sufficiently substantial and thereby manage to negate the bearish sentiment and terminate the broader trend, the price action is then likely to proceed in one of two ways.
It can either break out above the crucial level at 29.00 right away, or it could consolidate for the time being between it and the major support at 22.30, thereby creating a new Accumulation range.

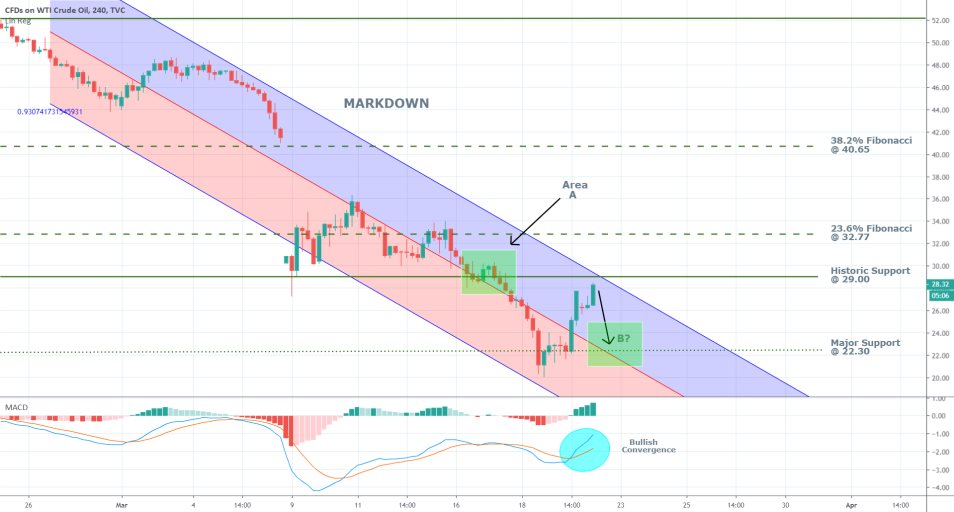
The short-term momentum is mostly bullish, as can be seen by the MACD on the 4H chart above. This favours the continuation of the bullish pullback's development and a potential formation of a breakout above 29.00.
Even though the price has entered into the upper part of the regression channel, which is manifesting the bullish commitment in the short run, any minor swings to the south are going to be quite illustrative of the likely future behaviour of the underlying price.
The last time the price was threading in the upper part of the channel was when area A was established. The bullish momentum was quickly negated after the price consolidated for a little while just above the historic support at 29.00 and the channel's middle line around the same level. The price subsequently broke down below the support, and that was the end of the last significant consolidation.
Currently, there are similar conditions on the market, and the price could end up behaving in a similar manner. If it breaks down below the channel's middle line, which this time coincides with the major support level at 22.30 (the potential area B), this would be a piece of strong evidence in support of the continuation of the broader bearish trend's development. In other words, a breakdown below 22.30 would be detrimental for the ambitions of the market bulls for a quick and decisive correction.
4. Concluding Remarks:
At present, there is no conclusive evidence, based on which traders can open long-term positions in either direction. A case can be made for the potential continuation in the bearish trend's development, towards the 20 dollars' mark. However, there is also a potential for the establishment of a short-term bullish correction above the crucial 29.00 price level.
The next few trading days are going to shed more light on whether the recent pullback has the capacity to evolve into a trend reversal pattern, or the prevalent bearish markdown is going to continue developing.

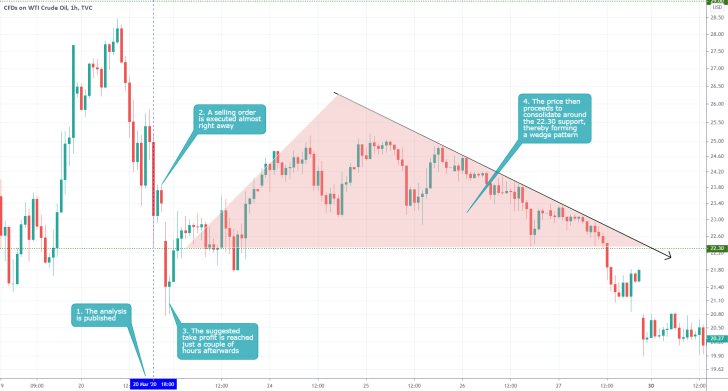
- An analysis that was suitable for less risk-averse traders at a time when the energy market was undergoing through considerable turmoil. The trade was executed when the bearish pressure was massive, which helped the trade. Not much to be said here. More risk-averse traders should not feel bad about not joining the market at such volatile times. Part of the successful risk management is to prepare for the worst, and the worst is most likely to arrive particularly at times when the market is in disarray.
Disclaimer: Your capital is at risk! Trading and investing on the financial markets carries a significant risk of loss. Each material, shown on this website, is provided for educational purposes only. A perfect, 100% accurate method of analysis does not exist. If you make a decision to trade or invest, based on the information from this website, you will be doing it at your own risk. Under no circumstances is Trendsharks responsible for any capital losses or damages you might suffer, while using the company’s products and services. For more information read our Terms & Conditions and Risk Disclaimer.


