The price action of the DAX is consolidating just below the pre-crash level at 13450.000 for the third time since the index started recovering in early-April. A potential bearish rebound from this level could entail the termination of the recent bullish rally. In contrast, another breakout would signify the continuation of the rally towards the all-time high near 13900.000. That is why the next step of the DAX will be of such great importance for its future development.
On the one hand, the stabilisation of the energy market complemented by rising oil prices, and the persisting vaccine optimism, would likely continue supporting the recuperation of the German index as global stocks advance. On the other hand, the rattled consumer confidence in the country already stymied the pace of DAX' bullish run, and traders may need further confirmation regarding the strength of the index.
ECB's highly anticipated monetary policy meeting on Thursday is bound to affect the European equity market, as the Governing Council may decide to recalibrate its Asset Purchase Facility programs. The outcome of the meeting could therefore serve as a catalyst for DAX' next price swing.
1. Long-Term Outlook:
As can be seen on the daily chart below, the underlying price action is so far failing to break out within the Resistance Area (in green) for the third time. This represents the most significant piece of evidence justifying the expectations for another deeper bearish correction.
If the price action does indeed rebound from the resistance, then the most likely target for such a newly emerging downswing would be the psychologically significant support level at 13000.000. Even though breakdowns below this important barrier seem highly improbable, temporary dropdowns to the 100-day MA (in blue) could be observed before the bulls regain full control. In such a scenario, the bulls would have a perfect opportunity to use trend-continuation trading strategies around the 13000.000 benchmark.
Conversely, if the price action manages to break out within the Resistance Area decidedly, then the road would be cleared for the first attempt for a rally to the major resistance level at 13800.000. A breakout above it would entail trading within a previously uncharted territory.
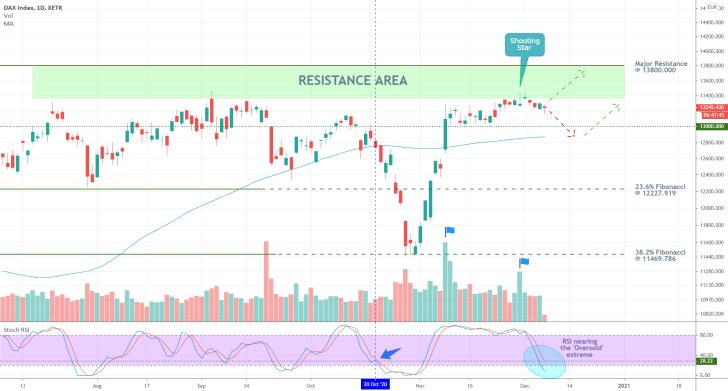
Notice that the overall traded volume (bullish) has been falling ever since the end of the last upswing, as represented by the two flags. Moreover, the last bullish climax (underpinned by the right flag) resulted in the development of a 'Shooting Star' candle, which typically entails rising bearish commitment. That is why the diminishing traded volume favours the establishment of a minor bearish correction next.
In contrast, the Stochastic RSI indicator is nearing the 'Oversold' extreme, which is likely to prompt more bulls to re-enter the market by placing new buying orders. Nevertheless, it should be mentioned that the last time the RSI was at the 28.22 mark was on the 20th of October. Subsequently, the price action went on to plummet by more than 1000 basis points. That is why it is crucially important that traders do not view the RSI as a trend-reversal indicator.
The currently subdued price action is resulting from the extremely low levels of executed trading volume, as was demonstrated above. However, ECB's meeting on Thursday could very well catalyse another upsurge in the underlying trading volume, which would then propel the price action in one of the two possible directions. Overall, the continuation of the bullish rally seems more probable given the bulk of the observed signals.
2. Short-Term Outlook:
As regards the behaviour of the price action in the short-term, it looks even more bullishly oriented. Following the first test (failed) of the Resistance Area since the last upswing, the price action fell to the 50-day MA (in green). The consolidation around it could be a precursor to another bullish rebound, which would represent an excellent opportunity for more trend-continuation trading from the current dip.
In other words, bulls should look for more pieces of evidence that the market has bottomed out around the current market price of 13240.000 – the peak of the last upswing, as represented by the two blue ellipses – so that they can enter long at a discount. This represents the first plausible scenario for future development (point 1 in purple).
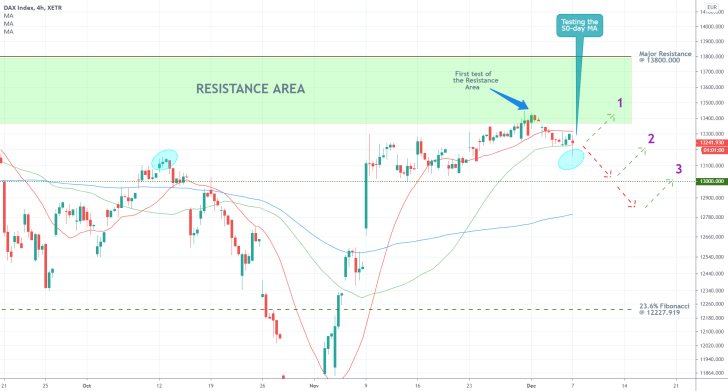
For as long as the three moving averages maintain the current Perfect Ascending Order – the 20-day MA (in red) trading above the 50-day MA (in green), which is trading above the 100-day MA (in blue) – the underlying bullish sentiment would be preserved.
A dropdown to the psychologically significant support at 13000.000 followed by a subsequent rebound represents the second plausible scenario for future development (point 2), whereas a deeper dropdown to the 100-day MA represents the third and least likely scenario (point 3).
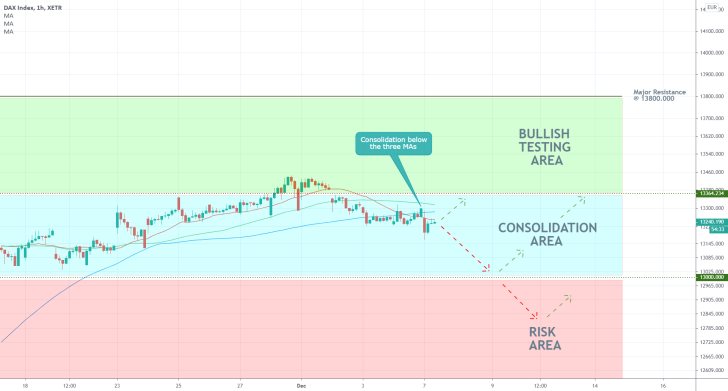
Therefore, less risk-averse traders can look for opportunities to place trend-continuation trades around the current market price; however, more risk-averse traders should mind the hourly chart below. As can be seen, the three moving averages do not have such a Perfect Ascending Order in the very short-term, and the price action is currently concentrated below them.
This relationship entails the risk of a dropdown to 13000.00 before another bullish rebound takes place. That is why more risk-averse traders can choose to wait for the price action to establish such a drop before they place-trend continuation trades. Similarly, they can wait for a breakout above 13365.000 (the lower boundary of the Bullish Testing Area) before they place reactive trades.
3. Concluding Remarks:
While the underlying technical and fundamental factors both seem to suggest a likely continuation of the bullish rally, traders should be careful because trading activity tends to fall by the end of the calendar year. The market tends to become more unpredictable as the overall liquidity falls, which is why traders need to factor in the possibility of erratic price fluctuations in the next following weeks.
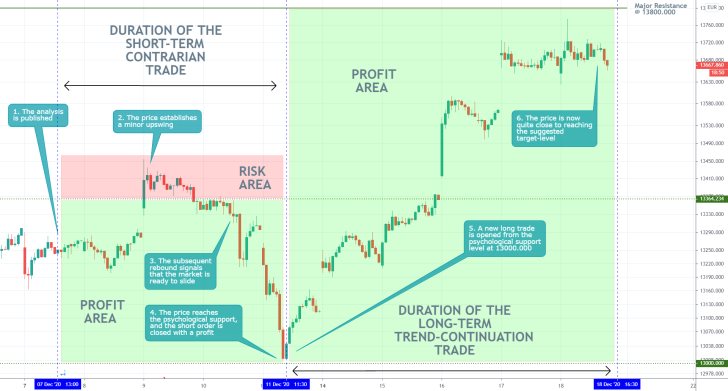
- One of the most successful analyses to date! Perfectly projected the initial correction to the psychologically significant support level at 13000.000, followed by the subsequent upswing towards the major resistance level at 13800.000.
Disclaimer: Your capital is at risk! Trading and investing on the financial markets carries a significant risk of loss. Each material, shown on this website, is provided for educational purposes only. A perfect, 100% accurate method of analysis does not exist. If you make a decision to trade or invest, based on the information from this website, you will be doing it at your own risk. Under no circumstances is Trendsharks responsible for any capital losses or damages you might suffer, while using the company’s products and services. For more information read our Terms & Conditions and Risk Disclaimer.


