The turbulent 2020 looks poised to end just like it began – with heightened fears stemming from the coronavirus crisis. Over the past several weeks, the number of confirmed COVID-19 cases has been steadily climbing in Europe, North America, and other parts of the world. Just today, the overall number toppled 40 million with over 1 million deaths.
The prospects of a dreaded second epidemic wave now seem undisputable, which means that world governments once again have to make pivotal decisions. The question of whether to reintroduce stringent containment measures and national lockdowns or to continue observing the situation unfold without intervening is once again on the agenda.
The former scenario would likely weigh down on the fragile global recovery, and lead to a muted global demand for oil. Similar developments were already observed in the first portion of the year. If the global oil demand were indeed to tumble once again, then oil futures are likely to stumble by the end of the year amidst the forecasts for heightened market tribulations stemming from the US presidential elections in early-November.
Additionally, the expectations for waning industrial activity in the Eurozone are likely to exert additional pressure on the price of oil. Hence, the underlying fundamentals seem poised to drive the price of crude down in the following months, but is there any technical evidence supporting these conjectures.
1. Long-Term Outlook:
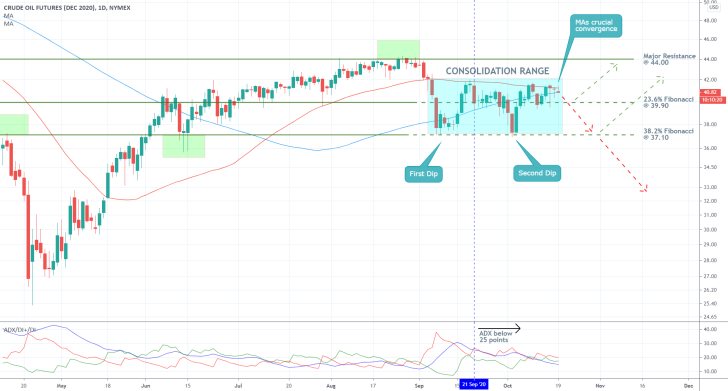
As can be seen on the daily chart below, the price action of the crude oil futures contract with expiry in December is currently concentrated close to the upper boundary of a major consolidation range (area in light blue).
The price was unable to break out above the major resistance level at 44.00 in the summer months when aggregate demand typically peaks and is currently trading much closer to the psychologically significant 23.6 per cent Fibonacci retracement level at 39.90. Such behaviour is demonstrative of waning bullish commitment in the market.
A potential breakdown below set level would likely drive the price action further down south towards the next Fibonacci barrier – the 38.2 per cent retracement at 37.10. Moreover, if the aforementioned fundamental factors become more pronounced as government restrictions increase in the near term, the price action could fall even lower.
There are several pieces of evidence justifying these forecasts. Firstly, the ADX indicator has been threading below the 25-point benchmark since the 21st of September, which means that the market is technically range-trading at present. Ranging environments typically entail a subtle transition of the underlying market sentiment by separating one trend from another. In particular, the currently evolving range could separate the previous bullish trend from a likely future downtrend.
Secondly, the 100-day MA (in blue) and the 50-day MA (in red) are currently converging towards each other, with the price action trading below the latter. A bearish crossover between the two – the latter crossing below the former – would underscore the existence of strong bearish sentiment, and would therefore likely represent an early indication of the formation of a new downtrend. Essentially, the two currently serve the roles of floating resistances, and a rebound of the price action from them would confirm the above-mentioned expectations.
So far, the price action has attempted forming two distinct downswings, both of which rebounded from the 38.2 per cent Fibonacci. The two resulting dips highlight the strong support around the 37.10 level, which could potentially act as a turning point once again.
In other words, robust indications are confirming the longer-term expectations for the formation of a new downtrend; however, the bears should observe the behaviour of the price action around the two Fibonacci retracements carefully, as these could serve as likely turning points.
2. Short-Term Outlook:
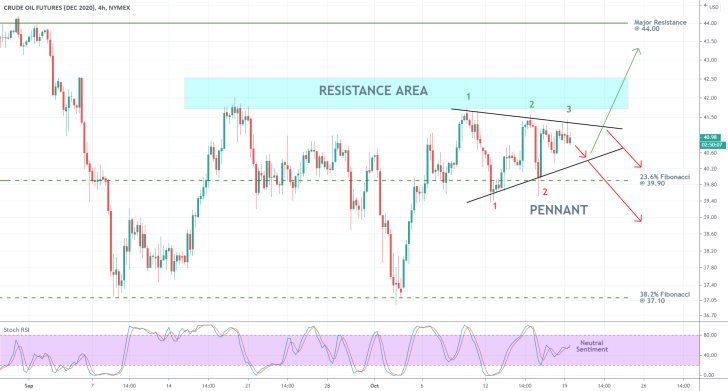
As can be seen on the 4H chart below, the price action is currently forming a 'Pennant' pattern. The first thing worth mentioning is that on the condition that it manages to break out above the upper boundary of the pennant decisively, the longer-term bearish projections would be invalidated, in which case the price action would be free to once again target the major resistance level at 44.00.
Such a turn of events could only pan out if the price action falls to the lower boundary of the pennant first before a rebound occurs. Meanwhile, there are two possibilities regarding the likely formation of the previously mentioned breakdown, which are represented on the chart below.
It should also be mentioned that at present, the Stochastic RSI indicator is demonstrating the neutral market sentiment, despite the range-trading environment. This undecidedness is likely to continue driving the price action in a tight range spanning between the pennant's two borders in the near future. In other words, the price action is likely to continue bouncing between 41.20 and 40.70 over the immediate future.
As was mentioned earlier, the bulls should look for definitive signs of a breakout above the pennant's upper limit. Otherwise, the underlying market environment would make the execution of any long orders too risky.
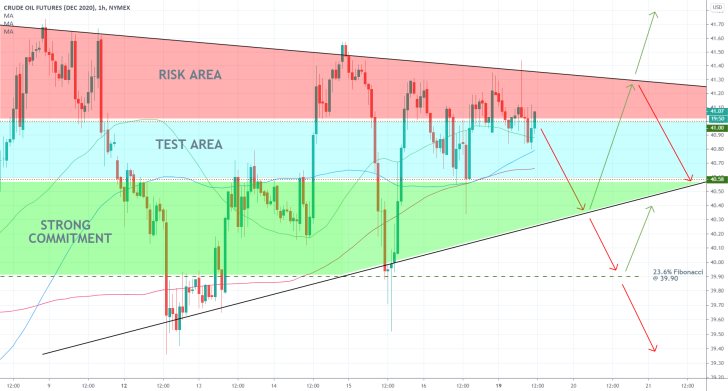
Accordingly, the bears currently face better prospects for placing short orders. As can be seen on the hourly chart below, there are three crucially important zones they need to be aware of, if they plan to sell the December oil futures.
Selling within the 'Risk Area' entails the threat of volatile fluctuations, which could hit any narrow stop losses. Meanwhile, selling within the other two areas would bear the risk of snap price rebounds, if the underlying market pressures were to change suddenly.
Ideally, the bears should look for entry possibilities close to the pennant's upper boundary, if at all possible. More risk-averse traders could wait for the completion of the first bullish correction following the eventual breakdown below the pennant's lower boundary so that they can implement trend-continuation trading strategies.
3. Concluding Remarks:
The underlying market setup seems suitable for long-term position traders, who would be looking for an opportunity to implement trend-reversal trading strategies - anticipating the likely emergence of a new downtrend from the current range.
In contrast, shorter-term traders could use swing trading strategies whenever the price action nears one of the pennant's two extremes. Such an approach would entail a higher degree of risk, but the payoff would be quicker returns. Such a strategy would work for as long as the price action remains concentrated within the boundaries of the pennant.
The First Stage is Over. Looking for Trend-Continuation Signals
The December Oil Futures behaved exactly as anticipated. Initially, the price action established a false breakout above the pennant's upper boundary, but the emergence of a massive Shooting Star candle (as seen on the 4H chart below) signalled that this adverse behaviour was only going to be temporary. The price action went on to develop a substantial breakdown below the pennant's lower border and the 100-day MA (in blue), which signalled the beginning of a new downtrend, as expected.
As regards the underlying fundamental outlook, little has changed since the publication of the original analysis. Things have only become more pronounced since then; chiefly, the coronavirus crisis. Many counties in Europe are setting new anti-records of confirmed COVID-19 cases every day, which exacerbates the already strained situation. The epidemic conditions in the US are deteriorating as well.
As the pandemic continues to grow in scope daily, so governments become increasingly compelled to reintroduce more stringent containment measures. As has already been seen at the beginning of the year, these work to the extent that they cushion the spread rate, but unfortunately, they hurt the global economy.
It follows that as the pandemic continues to worsen every day, the fallout from the worldwide effort to contain the virus would likely weigh down on the global energy demand. Hence, oil futures are very probably going to suffer from this subdued demand in the following weeks as the situation wraps, which is why the price action of CLZ2020 is expected to continue depreciating in the foreseeable future.
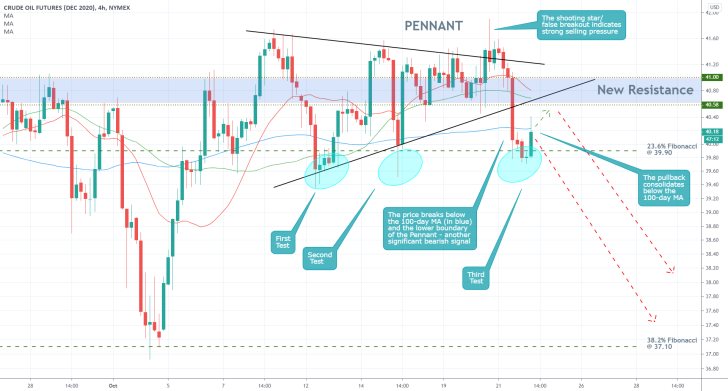
As regards the current technical outlook, the price action is evidently in the early stages of developing the new downtrend. As can be seen on the 4H chart above, following the aforementioned breakdown, the range between 41.00 and 40.58 has adopted a new role – that of a major resistance area. The currently developing bullish pullback is likely to rebound from set resistance before the establishment of the broader downtrend can be resumed.
The fact that the pullback sprang up from the 23.6 per cent Fibonacci retracement level at 39.90 is not surprising at all. It will allow trend-continuation traders to use appropriate strategies once the pullback is finalised – looking to sell at the new swing high before the price action resumes depreciating.
Notice that the price action is currently consolidating just below the 100-day MA, which is quite illustrative of the mounting bearish pressure. It means that the rebound could occur sooner than expected – from the moving average instead of the new resistance area. Hence, market bears should be looking for potential entries in the immediate future once there are definitive signs that the bullish pullback has been terminated.
Once the price action breaks down below the support level at 39.90, the next psychologically significant target would be the 38.2 per cent Fibonacci retracement level at 37.10. Keep watching the evolving relationship between the price action and the three moving averages – the aforementioned 100-day MA (in blue); the 50-day MA (in green); and the 20-day MA (in red). So far, the three MAs maintain an ascending order relative to each other, which could prompt the establishment of more bullish corrections in the near future. However, once the price action starts trading below the 20-day MA, which is positioned below the 50-day MA, which, in turn, is threading below the 100-day MA, this perfect descending order would manifest the existence of a strong bearish trend.
Temporary Vaccine Excitement Creates Good Opportunities to Join the Trend
Earlier today, the Financial Times reported that AstraZeneca's developmental coronavirus vaccine prompts an immune response in elderly people. If more clinical trials confirm this observation, the highly anticipated game-changing vaccine might finally be manufactured on a large scale, enough to combat the pandemic.
The markets reacted positively to the news, and the December oil futures jumped by over 1.40 per cent. This temporary excitement could result in the establishment of a minor bullish pullback, which, in turn, would allow more bears to join the evolving downtrend. Once the effect of the initial market surprise starts to wane, the overarching bearish pressure would likely resume driving the price action further down south.
So far, the market is behaving exactly as per the projections of our last follow-up of CLZ2020. That is why it is a good time to pay attention to the December oil futures once again and examine how these recent developments are likely to affect the prevailing market setup.
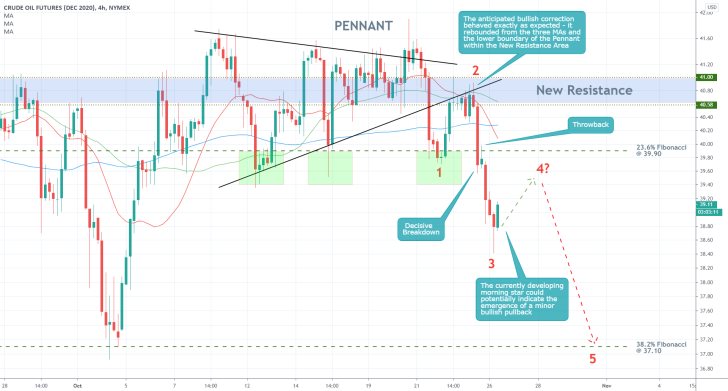
As can be seen on the 4H chart above, the price action did indeed establish a bullish correction after the rebound from the 23.6 per cent Fibonacci retracement level at 39.90, as per the projections of the last follow-up. Moreover, the bullish correction was terminated exactly as was expected – the price rebounded from the lower boundary of the Pennant and the three MAs (the 100-day MA in blue, the 50-day MA in green, and the 20-day MA in red), while it was contained within the New Resistance Area.
All of this signifies the beginning of the new downtrend, which is why the price action is expected to continue sliding towards the next psychological target level – the 38.2 per cent Fibonacci retracement level at 37.10 after the current bullish pullback is completed.
The developing downtrend is so far taking the form of a 1-5 impulse wave pattern, as postulated by the Elliott Wave Theory. Today's bullish pullback emerged from the bottom at point 3, which means that the AstraZeneca excitement is currently shaping the 3-4 retracement leg. Once there are clear indications that the price action has indeed peaked at point 4, the bears would be able to use trend-continuation strategies. More specifically, they would be able to sell at point 4 before the price action goes on to develop the final 4-5 impulse leg, expectedly towards the aforementioned support at 37.10.
Be aware that there is no way of knowing where exactly point 4 would peak, and that it has been plotted at a random location on the chart above. There, however, certain hints that traders could use to determine when the next reversal is likely going to take place.
They should be on the lookout for candles with huge upper shadows such as shooting stars. The emergence of these typically entails the completion of corrections and pullbacks.
There are two potential areas where such candles are likely to develop. Firstly, they could be established close to one of the three MAs (most likely the 20-day MA), as these are now serving the roles of floating resistances. Hence, the bears should look for reversal signals when the price action comes in contact with either of the three MAs next. Secondly, on the condition that the bullish pullback turns out to be a deeper one, the next potential turning point could be found close to the aforementioned 23.6 per cent Fibonacci retracement level, which is now serving the role of a resistance.
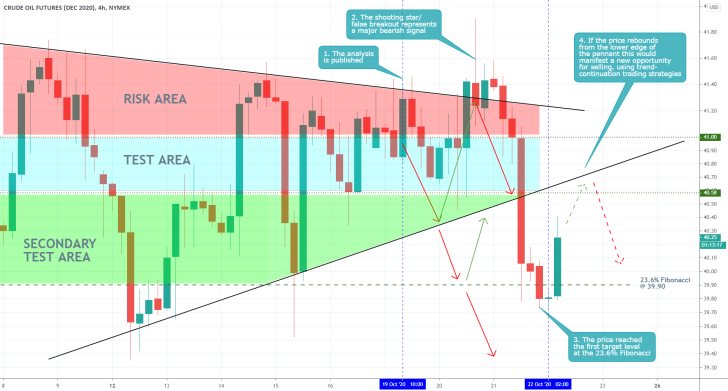
- The price action behaved almost exactly as anticipated. It should be noted, however, that the initial false breakout temporary shot up quite high before the price reverted itself. Such adverse fluctuations would have likely wiped out any prematurely placed short orders. Nevertheless, traders should be prepared for such things. Even more importantly, traders should remember that sometimes they need to place 1-2-3 or even more orders before they catch the big price swing. Some traders give up after the first failed attempt, which causes them even more frustration when they see the market eventually going in their initially anticipated direction. That is why a trader's composure is essential for his or her long-term success.
- The price action is currently establishing a bullish pullback, as was demonstrated in today's follow-up. Once this is done, market bears would have another opportunity to join the emerging downtrend by applying trend-continuation strategies.
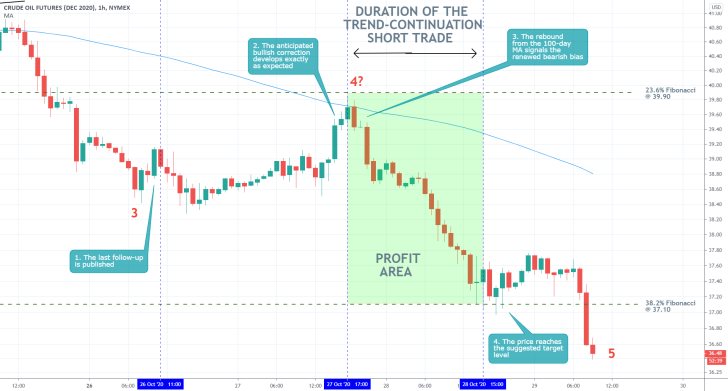
- An almost perfect execution of a trend-continuation trade. The last follow-up of the December oil futures quite accurately projected the emergence of a bullish correction towards point 4 (just below the 23. 6 per cent Fibonacci). Once the price rebounded from the 100-day MA (in blue), this sent a clear signal that the bearish momentum in the market was resumed and that the price action was ready to head towards the 38.2 per cent Fibonacci next.
- The above example demonstrates why it is so important for traders aiming to join an existing trend to keep calm and wait for an opportunity to enter at the end of a minor correction running contrary to the direction of the broader trend.
- With that, the primary expectations of the initial analysis are fully realised. The price action is likely to keep falling, given the gloomy outlook for the global economy.
Disclaimer: Your capital is at risk! Trading and investing on the financial markets carries a significant risk of loss. Each material, shown on this website, is provided for educational purposes only. A perfect, 100% accurate method of analysis does not exist. If you make a decision to trade or invest, based on the information from this website, you will be doing it at your own risk. Under no circumstances is Trendsharks responsible for any capital losses or damages you might suffer, while using the company’s products and services. For more information read our Terms & Conditions and Risk Disclaimer.


