The EURUSD has advanced considerably over the past several weeks, and the long-awaited correction still hasn't arrived. The greenback is still reeling from the massively disappointing U.S. employment data for April, which drove the pair even higher on Friday.
Nevertheless, the critical inflation data that is scheduled for publication this week could alter the underlying market pressures. The tech sector woes are exacerbated by growing investors' fears concerning inflation, which is having a positive impact on commodity prices and safe-havens in general.
This transformational change in the underlying market dynamics that is brought about by uncertainty increasing parallel to the rising production costs, could turn out to be the much-needed respite for the struggling dollar.
In other words, growing inflation concerns could tip the current demand pressures on the EURUSD, catalysing the long-awaited bearish correction on the pair. The underlying fundamental factors seem to be aligned to that end.
Breaking the Trend Line:
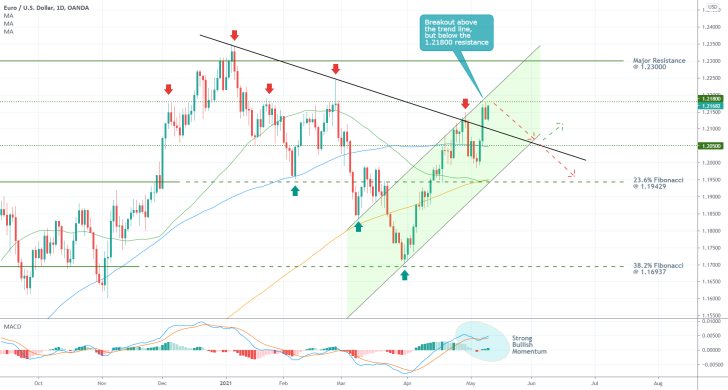
As can be seen on the daily chart below, the latest EURUSD upswing continues to advance within the boundaries of an ascending channel. The price action is currently touching the upper boundary of the channel, which represents the first indication of a potential dropdown in the making.
The price is also probing the major resistance level at 1.2800, which has already acted as a turning point on several occasions in the past. It could cause yet another bearish retracement, at least to the closest support level at 1.20500.
This is where such a correction is also likely to meet the descending trend line, whose recent penetration represents a major bullish indication. Moreover, the 1.20500 support level is currently converging with the 100-day MA (in blue), which serves as a floating support of considerable importance.
A deeper bearish correction could target the 23.6 per cent Fibonacci retracement level at 1.19429, whose psychological importance is enough to make it a crucial target. Also, the 23.6 per cent Fibonacci is currently converging with the 100-day MA (in blue) and the 200-day MA (in orange), making it even more robust support.
The peaking bullish momentum, as demonstrated by the MACD indicator, elucidates two things. First of all, the expected bearish correction is yet to start developing. Second of all, the buying pressure climax could pan out to be the starting point for such a correction. In other words, despite the strong bullish pressure at present, the time seems right for the immediate beginning of a new correction.
The end of the Wedge:
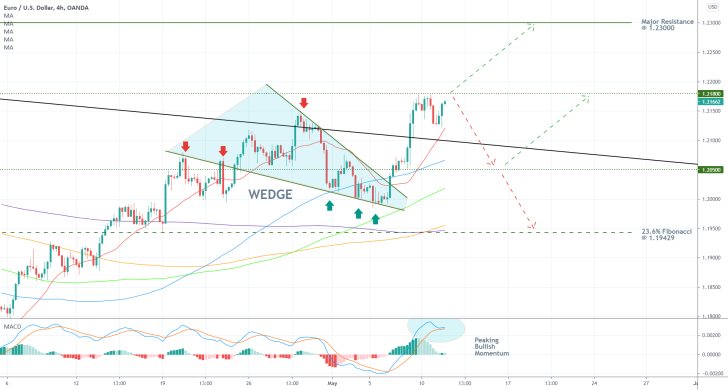
Another reason as to why the latest upswing could be drawing to a close can be observed on the 4H chart below. The breakout above the descending trend line (in black) coincided with the completion of a major Wedge. Such patterns typically indicate likely trend continuations, which already happened as the price rose from 1.20500 to 1.218000.
A potential reversal from the latter could therefore be interpreted as a likely indication of the last upswing's completion. An eventual breakdown below the 20-day MA (in red) and the descending trend line would clear the way for a more sizable drop to 1.20500, which is currently being crossed by the 100-day MA. The 150-day MA (in light green) is also drawing close to 1.20500.
An even deeper correction could fall as low as the 23.6 per cent Fibonacci retracement level at 1.19429, as stated earlier. This prominent support level is currently converging with the 200-day MA (in orange) and the 300-day MA (in purple).
Despite the fact that the underlying momentum is indeed peaking at the present moment, the possibility of a breakout above 1.21800 should not be wholly overlooked. A decisive breakout above it would allow for a potential continuation of the underlying uptrend towards the next bullish target - the major resistance level at 1.23000.
Crucial entry levels to keep an eye on:
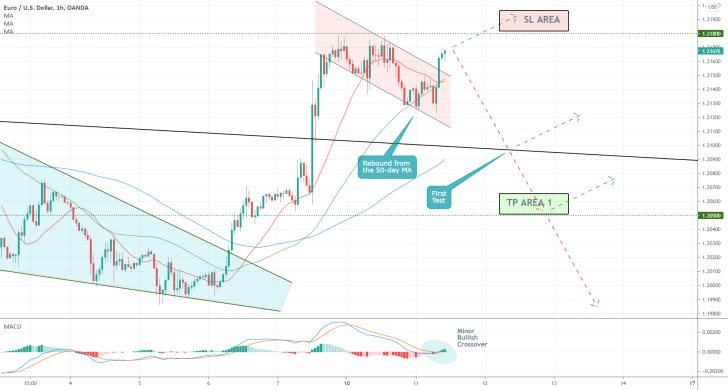
The hourly chart below demonstrates the potential entry levels for a setup in anticipation of a bearish correction in the near future. Following the completion of the aforementioned Wedge, the EURUSD went on to establish a minor Flag as well.
On the one hand, it too takes the function of a likely trend continuation signal, which would favour the continuation of the uptrend. This assertion is also supported by the fact that the price action rebounded from the 50-day MA (in green) several hours ago. The MACD registered this breakout above the Flag's upper boundary with a minor bullish crossover.
Despite all of this, however, the underlying outlook in the short room looks prevailingly bearish. Hence, bears can look for an opportunity to go short on the EURUSD somewhere below the 1.21800 resistance. Consequently, a stop-loss order should be placed just above this resistance level.
Concluding Remarks:
As mentioned earlier, the first target for such a correction would be the support level at 1.20500. If the price manages to fall below it, bears could either move their stop orders to that threshold, or they could incorporate floating stop orders in order to squeeze the maximum from a potential correction that heads even further down south.
EURUSD is Developing an Ascending Wedge Pattern
The EURUSD has risen markedly over the past several weeks, driven mostly by the dollar's depreciation. The primary cause of this was lifted investors' sentiment, as the pace of global recovery picked up in Q1. Capital was transferred from lower-risk securities into assets entailing higher returns.
This trend, however, could be reversed soon, as inflation woes are increasing. Traders and investors are getting worried that the faster-than-expected recovery runs the risk of overheating the global economy. Such concerns are fuelling an upsurge in demand for lower-risk securities once again, especially for precious metals.
While this does not immediately mean that the EURUSD is ready to fall right away, a potential uptick in demand for safe-havens could strengthen the reeling greenback. This, consequently, would affect the EURUSD and potentially incite a new bearish correction.
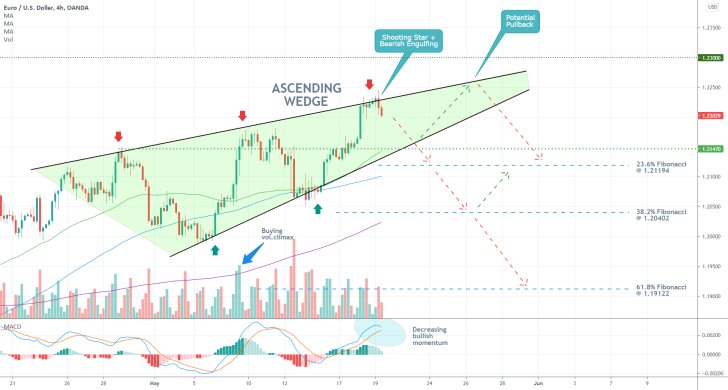
There are early signals of waning bullish commitment in the market, as can be seen on the 4H chart above. Again, this does not necessarily imply an immediate bearish reversal; however, it could lay out the foundations for a future reversal.
The uptrend has started developing more waves recently, which underscores growing volatility. These waves have taken the shape of an Ascending Wedge pattern, which, when found at the top of an existing uptrend, typically signifies upcoming reversals.
The lower boundary of the Wedge has been tested on two occasions, whereas its upper boundary has been probed three times. This means that the EURUSD may need to develop one additional wave (a dropdown followed by a pullback) before such a reversal can unfold.
The dropdown is ready to begin developing in the short-term, seeing as how the price action has established a Shooting Star pattern recently. Again, such a dropdown is likely to bottom out at the lower end of the Wedge.
This assertion is further substantiated by the fact that the previous swing high (at 1.21470) is about to cross the lower limit of the Wedge. This would be a classic example of a resistance-turned-support.
Ultimately, the MACD indicator is underscoring a Divergence in the making. This is also manifested by the fact that the price action is establishing lower swing peaks while the underlying buying volume has already climaxed. All of this is demonstrative of waning bullish sentiment.
Bears can look to sell near the current market price (the first target is the lower boundary of the Wedge), however, they should be aware of a potential bullish rebound to the upper limit of the Wedge once more.
The 23.6 per cent Fibonacci retracement level at 1.21194 and the 38.2 per cent Fibonacci at 1.20402 represent deeper targets for the new downtrend.
EURUSD Finally Looks Ready to Break the Ascending Wedge
EURUSD's underlying uptrend has been able to score consecutively higher peaks on each subsequent wave; however, the length of each wave has been noticeably smaller than the one preceding it. This implies waning bullish commitment, a likely precursor to a long-anticipated bearish reversal.
The euro was strengthened momentarily last week on the better-than-expected industry numbers in the Eurozone, which underpinned the ongoing digitalisation process in Europe. The market has already priced in this data, and the bullish momentum is thus spent.
Without any major releases in the economic calendar this week, this trend of exhaustive bullish pressure is thus likely to resume. The only source of extra volatility is the recently escalated tensions between the EU and Belarus.
Given that the U.S. quarterly GDP numbers are up for publication tomorrow, the time seems right for a potential bullish correction on the pair.
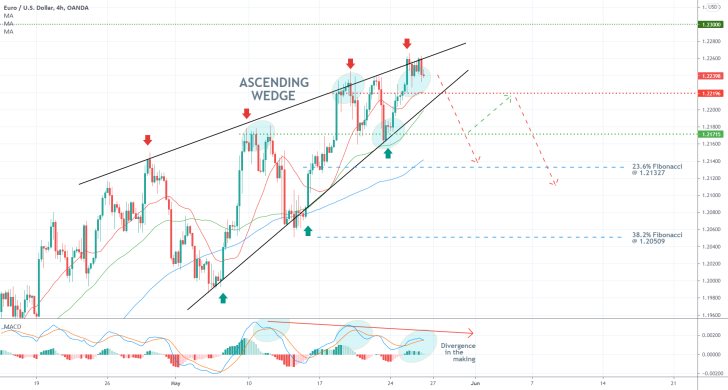
As can be seen on the 4H chart above, the price action has been developing a massive Ascending Wedge that was highlighted in our previous analysis of the pair. It has rebounded from the lower boundary of the pattern on three separate occasions, as well as having retraced from its upper border four times. This implies that the EURUSD may finally be ready to break away from the borders of the Wedge.
These expectations are further substantiated by the MACD, which is underpinning a divergence in the making. Such a reading of the indicator is to be expected if the pair is indeed about to establish a decisive breakdown.
Less risk-averse traders could look for an opportunity to sell around the current market price; however, they should place tight stop-loss orders just above the latest swing high.
They should pay close attention to the behaviour of the price action around the lower boundary of the Wedge and the major support level at 1.22196. The significance of the former stems from the fact that it coincides with the 50-day MA (in green), while the latter is converging with the 20-day MA.
If the price manages to break down below the two decisively, the next target for the emerging downtrend would be encapsulated by the major support level at 1.21715. A deeper correction could fall to the psychologically significant 23.6 per cent Fibonacci retracement level at 1.21327.
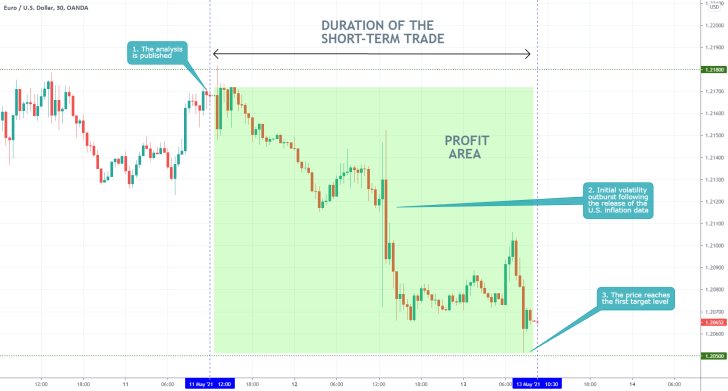
- The expectations of the analysis are promptly being realised. The price started depreciating almost immediately following the publication of the analysis, and it reached the first target level at 1.20500 on the next day.
- The major catalyst for the strengthening of the greenback was the U.S. inflation data for April.
- Traders should keep in mind that using proactive trading strategies (placing orders before the release of important economic numbers) entails a considerable degree of risk. Market surprises tend to cause erratic price fluctuations.
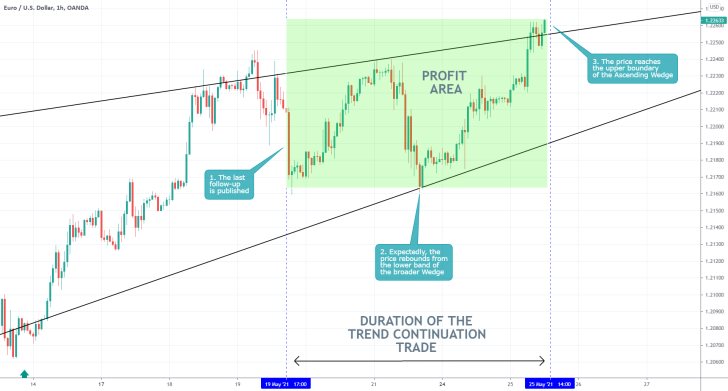
- Our last follow-up analysis of the EURUSD successfully caught the rebound of the price action from the lower end of a broader Wedge pattern, shortly after its publication.
- Traders can always try to pick bottoms and tops in an established pattern, provided that they are certain the underlying price action is indeed developing such a structure.
- They should always place tight SLs just beyond the boundaries of such patterns.
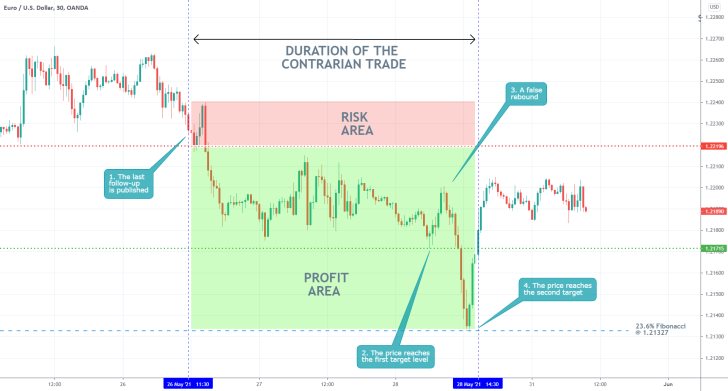
- The price of EURUSD behaved exactly as expected shortly after the publication of our last follow-up. It fell to the second target level, underpinned by the 23.6 per cent Fibonacci retracement level at 1.21327.
- There is not much else that could be said about the execution of the trade. The precise timing of the contrarian trade was its best aspect.
Disclaimer: Your capital is at risk! Trading and investing on the financial markets carries a significant risk of loss. Each material, shown on this website, is provided for educational purposes only. A perfect, 100% accurate method of analysis does not exist. If you make a decision to trade or invest, based on the information from this website, you will be doing it at your own risk. Under no circumstances is Trendsharks responsible for any capital losses or damages you might suffer, while using the company’s products and services. For more information read our Terms & Conditions and Risk Disclaimer.


