Alphabet Inc., which is one of the world's largest corporations and also the parent company of the Google search engine, is reporting quarterly earnings on Tuesday, and investors are eager to see how the multinational conglomerate is faring during the coronavirus pandemic. The company would be reporting earnings for Q1 of 2020, which ended in March.
Being a multinational company with worldwide operations, Alphabet's performance this quarter is going to be impacted by the timing and extent of the national lockdowns globally. In other words, the impact of the global coronavirus crisis is mostly going to be reflected on Alphabet's earnings report for the period after Late-February/Early-March. Due to the limited use of Google as a search engine in China, the country's lockdown, which was initiated in Late-January, is not likely to have a strong impact on the company's revenue streams in either way.
Unlike most companies that are going to be impacted negatively by the closedowns of economies everywhere, Alphabet, similarly to Netflix, is one of those few companies that are almost certainly going to benefit from the resulting situation. As billions of people are forced to keep social distancing by staying home as much as possible, internet usage and traffic are expected to have skyrocketed over the last quarter.
Hence, the usage of Alphabet's services is anticipated to have increased markedly over that period; however, investors are uncertain by how much this would bolster the company's quarterly revenues. Consequently, in Alphabet's case, higher customers' engagement is not necessarily going to yield proportionate revenue growth.
Therefore, the purpose of this analysis is to delve into the most important metrics and numbers, that investors are going to watch for when Alphabet's earnings report is released on Tuesday. Additionally, a technical examination of the underlying price action is going to be derived in relation to the perceived impact of these fundamental factors.
1. Long Term Outlook:
As is the case with most earnings reports' releases, immediately following the data publication this Tuesday, the price action of Alphabet's shares can be anticipated to become quite volatile as the market prices in the perceived impact of the report's findings. This volatility is likely to propel the price action towards the direction of the most recent swing on the weekly chart below.
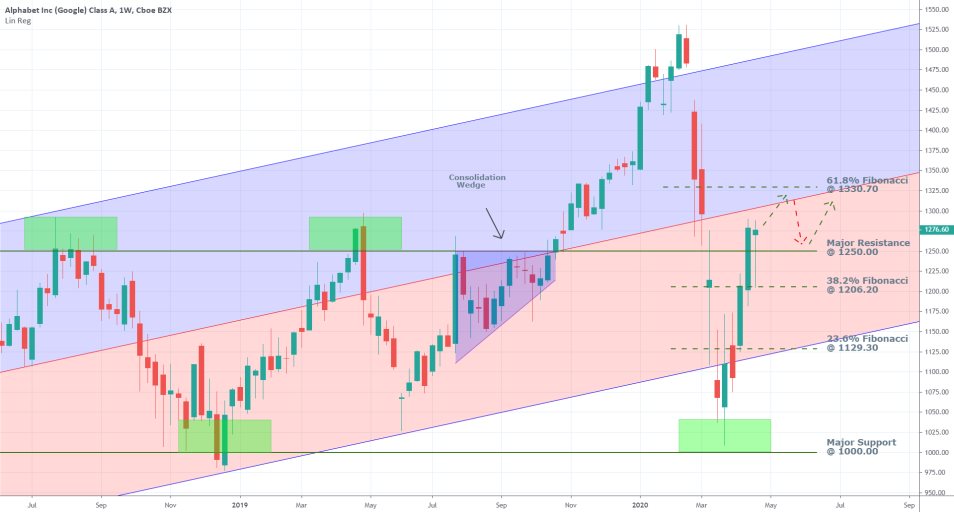
As can be seen, the selloff, which was initiated by investors' sweeping fear in the wake of the coronavirus crisis that impacted all industries alike, reached and then bounced back from the major support level at 1000.00. The level itself bears significant psychological importance due to the three zeroes in the number. The termination of the selloff at that particular level underpins massive buying pressure around it, which means future breakdowns below it are unlikely.
Subsequently, the price action has managed to advance north and break out above several prominent levels (temporarily serving as resistances). Last week Alphabet's share price managed to consolidate above the major resistance level (currently serving as support) at 1250.00. The next major test for the presently developing rally would be the 61.8 per cent Fibonacci retracement level at 1330.70, which is serving as a prominent resistance. We anticipate the rally's strength, which looks more like a decisive U-turn rather than a typical bullish trend, to diminish in the next several weeks. As this happens, we expect the price action to transition into range-trading between the resistance level represented by the 61.8 per cent Fibonacci retracement, and the major support level at 1250.00.

There are several reasons, based on which we derive our projections for a presently developing new range. First of all, the major resistance (support) level at 1250.00, has been established as a prominent turning point on several occasions in the past, which makes it unlikely for the price action to revert itself back after the recent breakout. Last week's candlestick, with its massive lower shadow that temporarily fell to the 38.2 per cent Fibonacci retracement at 1206.20, but then quickly bounced back up, confirms the existence of this substantial buying pressure.
Second of all, the resistance level at the 61.8 per cent Fibonacci retracement is already a well-known potential turning point for the underlying direction of the price action, being one of the significant Fibonacci levels. In addition to this, the level coincides with the middle line of the ascending channel, which further boosts its prominence, consequently making it more difficult for the rally to break out above it.
We anticipate the price action to consolidate below the ascending channel's middle line and the resistance level at 1330.70, similarly to what happened the last time the price action traded in a range below the channel's middle line. The price action eventually broke out above the middle line, but not before establishing a significant consolidation wedge. That is why we expect the price action to bounce up and down between 1250.00 and 1330.70, thereby creating a similar consolidation pattern that is characteristic to range-trading environments, before the market can become trending once again. An eventual and decisive breakout above 1330.70, or breakdown below 1250.00 is going to illustrate the likely direction for this new trend.
2. EPS, Paid Clicks, and Cost-Per-Click Will be the Highlights of Tuesday's Report:
Three crucial actors of tomorrow's earnings data are going to draw the most attention from investors, thereby having the most significant impact on the underlying price action.
- Earnings Per Share. As is the case with every company's quarterly report, the first thing that investors and traders look for are the EPS numbers, and whether the company in question managed to surpass its last recorded performance.
Alphabet had reported EPS of $15.35 for Q4 2019, and EPS of $11.9 for Q1 2019. The consensus forecasts project a sizable dropdown to $10.97 to be reported tomorrow, which would underpin a deterioration on a quarter-over-quarter basis, as well as a worsening for the same period on a year-over-year basis. Hence, if the findings of tomorrow's report indeed meet the consensus forecasts, the share price of Alphabet is likely to fall due to investors and traders' disappointment. The opposite would be true if the company reports EPS above $10.97.
- Number of Paid Clicks. This is the metric that illustrates the internet traffic that has been generated by users of Alphabet's services over the previous quarter. Naturally, if the number of paid clicks has increased compared to Q1 2019, this would be welcoming news and should support the strengthening of the underlying price action.
According to the company's earnings report for Q1 2019, the positive change in paid clicks was recorded at 23 per cent compared to Q1 2018.
" The number of paid clicks through our advertising programs on Google properties increased from 2018 to 2019 due to growth in views of YouTube engagement ads; increase in clicks due to interrelated factors, including an increase in search queries resulting from ongoing growth in user adoption and usage, primarily on mobile devices; continued growth in advertiser activity; and improvements we have made in ad formats and delivery."
Hence, if this key metric is reported to have surpassed 23 per cent in the three months ending March 2020, Alphabet's share price is likely to appreciate as a consequence.
- Cost-Per-Click Change. The other important metric to watch for, a positive change in the observed C.P.C. would likely bolster the impact of the previous parameter, whereas a reported decrease in the C.P.C. from a quarter earlier would offset the effect of a positive change in the number of paid clicks (if any). This was the case in Q1 2019, when C.P.C. was reported to have depreciated by 7 per cent, thereby distorting the otherwise positive impact of the 23 per cent increase in the number of paid clicks.
" The positive effect on our revenues from an increase in paid clicks was partially offset by a decrease in the cost-per-click paid by our advertisers. The decrease in cost-per-click was primarily driven by continued growth in YouTube engagement ads where cost-perclick remains lower than on our other advertising platforms."
The consensus forecasts for Q1 2020 project a continuation of this trend of falling cost-per-clicks. Even if Alphabet reports such a negative change, the impact is likely to be less pronounced if the reported deterioration is smaller than 7 per cent. Conversely, if the negative change in C.D.C. exceeds 7 per cent, its adverse impact on the price action is likely to be more sizable.
3. Short Term Outlook:

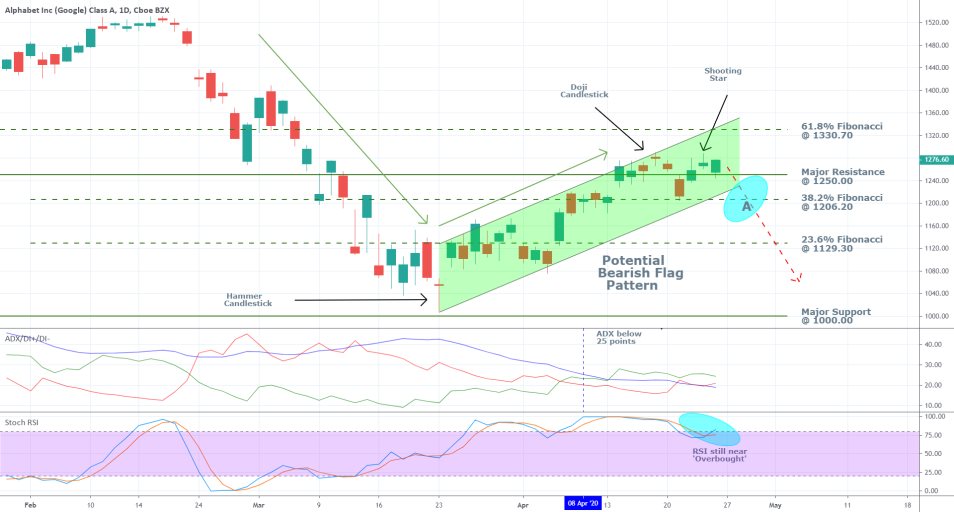
The ADX on the daily chart above has been threading below 25 points since the 8th of April, which is inlined with our anticipations regarding the likely transition of the current market rally into a new range. As the ADX continues to fall, thereby illustrating the waning commitment of the bullish trend, the price action becomes increasingly likelier to stop trading within the boundaries of the ascending channel represented on the chart above.
There is, however, a potential scenario in which the current stock rally is not followed by a new range, but rather by an immediate bearish trend. This would happen if tomorrow's report turns out to be unexpectedly weak, and the initial shock causes the share price to plummet. In this case, the price action would go on to develop a Bearish Flag Pattern. The underlying market sentiment would become prevailingly bearish if the price action manages to successfully break down below the major support level at 1206.20 at the 38.2 per cent Fibonacci retracement (point A on the chart). If it does not, then the expectations for the formation of a new major range illustrate the most likely future development of the price action.
The hammer candlestick at the very beginning in the formation of the current rally manifested the rising bullish sentiment at that time; however, the recent establishment of a Doji candlestick followed by a Shooting Star could be interpreted as signalling the likely termination of set rally. The existence of such candlesticks at the top of a recent bullish trend typically signifies its forthcoming completion, followed by a likely dropdown.
The Stochastic RSI seems to support such fears, given that the indicator continues to thread near the 'overbought' extreme, which could prompt the execution of more selling orders around the current market price. This, in turn, could affect the underlying demand pressures, potentially triggering the formation of a more substantial bearish swing.
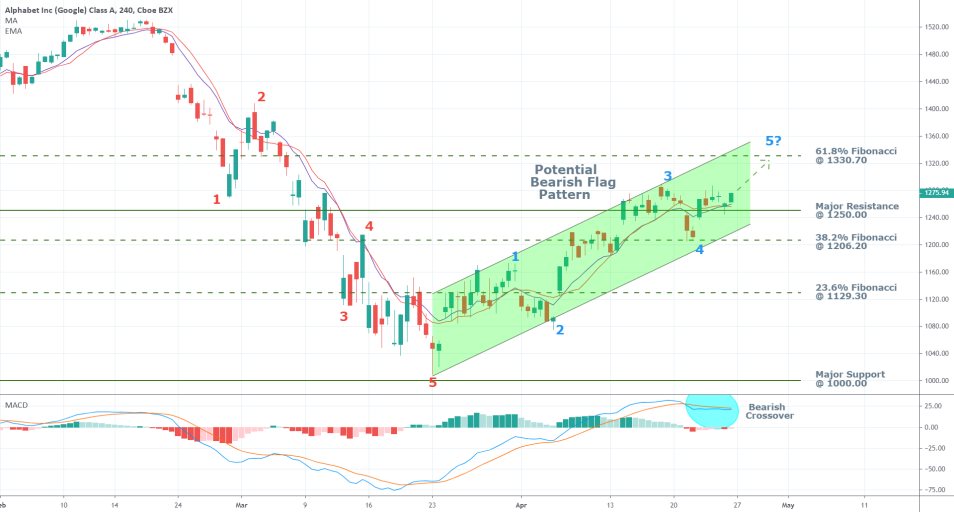
The 4H chart below demonstrates that the price action has developed (almost) two consecutive 1-5 Impulse Wave Patterns, which are postulated by the Elliott Wave Theory. The bearish representing the selloff, and the currently evolving bullish one is characterizing the subsequent rally. As can be seen, the second 1-5 pattern has not been concluded yet, and the final 4-5 impulse has to be finished first. This is in line with expectation for the formation of a new range between the 61.8 per cent Fibonacci retracement at 1330.70 and the major resistance (currently support) level at 1250.00.
Finally, the MACD continues to demonstrate the prevalence of bullish momentum in the market. Nevertheless, the recent bearish crossover, which is the first since the rally was commenced, could represent an early indication pointing towards the rally's likely termination in the near future.

4. Concluding Remarks:
Overall, two plausible scenarios are outlining the likely future behaviour of Alphabet's share price. The recent rally could either end with the market transitioning into a range-trading environment, or the share price could crash, resulting in the formation of a new bearish trend. The release of tomorrow's earnings report is going to be a significant catalyst for either of these two scenarios, depending on the findings of the report.

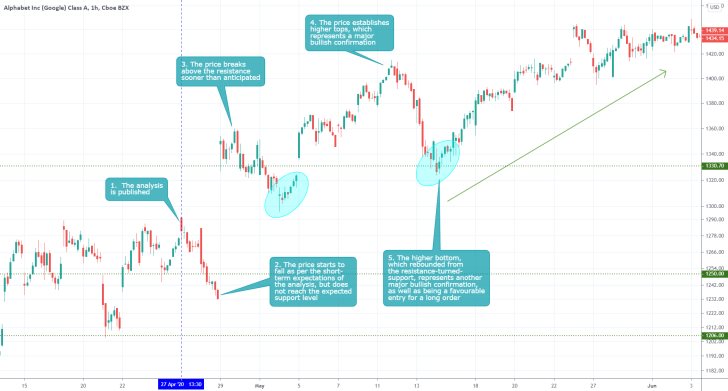
- The short-term expectations for a minor dropdown were realised, however, the price did not fall to the expected support at 1206.00. Instead, the price rebounded shortly after the publication of the EPS report. The sudden and unexpected jump of the share price elucidates the reason why traders, especially retail traders with smaller accounts, are better-off practising reactive trading as opposed to proactive trading. In other words, they stand a much better chance at avoiding incurring losses from unexpected volatility outbursts if they join the market only AFTER it has priced in the impact of a highly anticipated event, such as Google's earnings report.
- A reactive trader would have responded to the changed behaviour of the price action after the levels of adverse volatility had started to wane, by placing a trend-continuation long order.
Disclaimer: Your capital is at risk! Trading and investing on the financial markets carries a significant risk of loss. Each material, shown on this website, is provided for educational purposes only. A perfect, 100% accurate method of analysis does not exist. If you make a decision to trade or invest, based on the information from this website, you will be doing it at your own risk. Under no circumstances is Trendsharks responsible for any capital losses or damages you might suffer, while using the company’s products and services. For more information read our Terms & Conditions and Risk Disclaimer.


