Google's parent company Alphabet Inc. is scheduled to report its quarterly earnings for the three months leading to December 2020 tomorrow after the market close. What most investors and traders will be looking for in the earnings report of the Silicon Valley giant are clues that the company can continue to outperform the rest of the U.S. tech sector in terms of value growth.
Alphabet has been able to nearly double in stock value since the initial coronavirus crash in early April 2020, despite uneven revenue growth. Part of the explanation has to do with the fact that many people across the world are still forced to work from home due to the pandemic, which has resulted in a substantial increase in the number of hours people spend online. The benefits for Alphabet from this are twofold - more revenue from advertising, as well as from cloud services. The latter is one of the key metrics that warrant closer attention tomorrow.
According to the consensus forecasts, Alphabet is expected to post earnings per share of $15.89 for Q4, a marginal increase from the $15.35 that was reported for the same period a year prior.
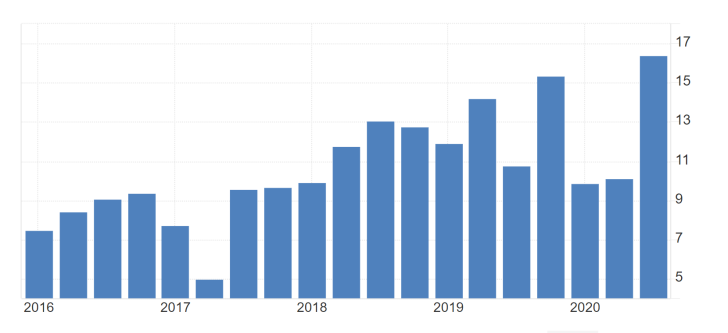
Despite the underlying expectations for another solid quarterly performance, Alphabet still finds itself in hot waters amidst more antitrust suits. When coupled with the general unease that is currently prevailing on the stock market due to the GameStop saga, Alphabet's remarkable bullish run could be suddenly challenged tomorrow.
Such mixed signals could likely lead to massive levels of adverse volatility - possibly even more so than what is typical for Alphabet around the time it releases its quarterly reports - which would make trading difficult. Once such erratic fluctuations start to wane, it is entirely plausible for Alphabet's shares to follow suit to Apple, Morgan Stanley and JPMorgan Chase in establishing a new bearish correction.
1. Long-Term Outlook:
It becomes apparent from the daily chart below that the price action is currently consolidating just below the all-time high resistance at 1900.00, in an attempt to prepare for a potential breakout. An ascending triangle pattern was concluded recently, which typically entails strong bullish bias in the market. It is commonly perceived as a trend-continuation pattern, which is why the price action is likely to continue climbing in the near term.
It is interesting to note that the role of a lower boundary of the Triangle was taken by the 23.6 per cent Fibonacci retracement level at 1718.00. The latter's significance is also confirmed by the fact that it had previously served as a swing high (the red arrow), indicating a resistance-turned-support. Moreover, the eventual breakout from the Triangle occurred just as the price action had tested the ascending channel's lower border. All of these factors underline the existence of strong bullish sentiment in the market.
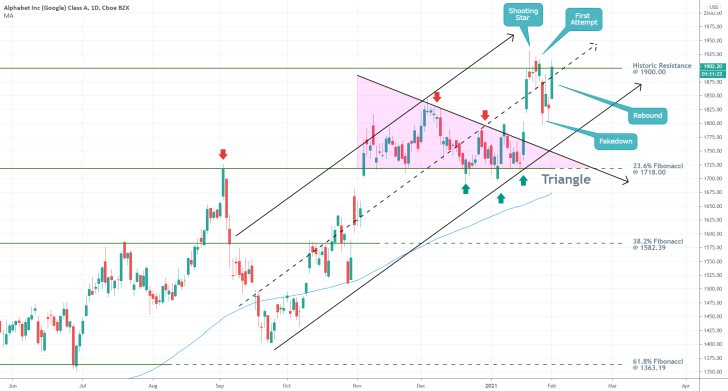
At present, the price action is probing the strength of the 1900.00 resistance while also concentrating around the channel's middle line. The snap bullish rebound following the fakedown is also indicative of strong bullish commitment; however, this does not necessarily mean that the market is bound to break higher.
As mentioned earlier, volatility is likely to surge after the release of the EPS data, resulting in upswings past the resistance. However, traders should keep in mind that sudden breakouts have a high probability of being followed by corresponding retracements.
Most importantly, a breakout above 1900.00 would mean that the price action will have the psychological resistance at 2000.00 as its next obstacle. The strength of the latter should be more than clear to everybody. Therefore, if a correction does not emerge immediately, the likelihood of it developing around the 2000.00 threshold will be significantly increased.
2. Short-Term Outlook:
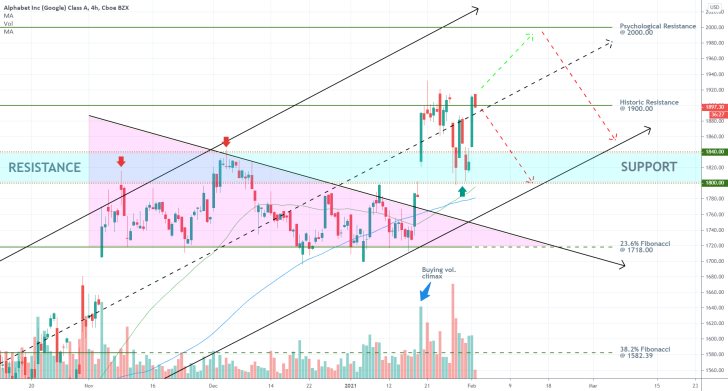
As shown on the 4H chart below, there two likely ways in which the price action could behave following the release of the earnings data. It could either immediately head towards the psychological resistance at 2000.00 (provided that the EPS data turns out to be exceptionally robust), or it could slide towards one of the two extremes of the resistance-turned-support area (in light blue).
The 50-day MA (in green) and the 100-day MA (in blue), are both currently converging towards the lower limit of the support area, which means that more substantial breakdowns below it seem less likely. Moreover, the lower edge of the ascending channel is also crossing the support area, adding to its strength.
Given that a buying volume climax was reached recently, the likelihood of a bearish rebound taking place soon seems increased.
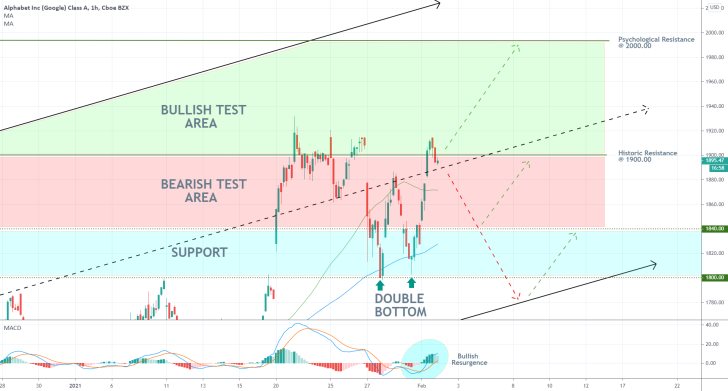
The hourly chart below outlines the next battleground for bears and bulls. When considering how to execute a particular trade, one should observe the relationship of the price action to the two test areas around the time of the earnings report's release. In other words, they could use the extremes of the three areas (support also included) as benchmarks for potential entry or exit levels.
The recent upsurge in bullish momentum, as underscored by the MACD indicator, should also be mentioned.
3. Concluding Remarks:
Bulls should not be in a rush to go long before the release of the data. The market already finds itself in a solid uptrend, so premature entries would expose traders to risk from even average in size fluctuations. Instead, bulls can wait for the next bearish correction to bottom out (potentially around the support area in blue) before they adopt trend-continuation strategies.
In contrast, bears face even more risks because they would have to implement contrarian trading strategies. The expectations for massive levels of adverse volatility could degrade from the precision of such trading almost to the point where it would no longer be justified.
While there is a strong case to be made here for a likely correction emerging from the 1900.00 resistance, bears seemingly stand a better chance of looking for potential entries near the psychological resistance at 2000.00.
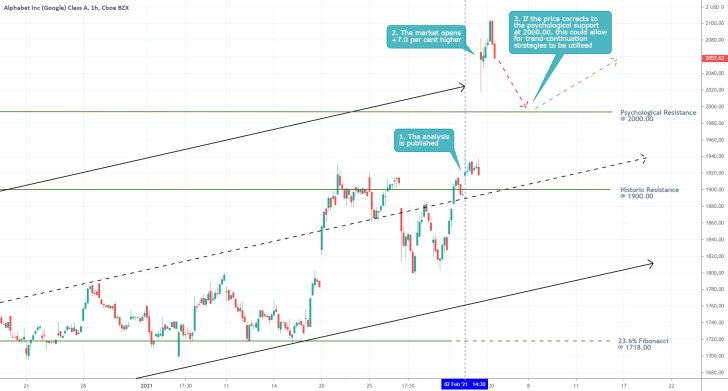
- The recent Alphabet Inc analysis quite correctly projected a likely upsurge in the company's share price following the release of the earnings report; however, it was argued against proactive trading. In the analysis, the possibility of massive volatility surrounding the EPS numbers was highlighted, which was then pointed out as a primary reason why traders would be better-off to refrain from proactive trading.
- Ultimately, there was indeed a massive upsurge in volatility, and the share price did indeed rise. However, the trading opportunity would have been available only to proactive traders. This is an example of why traders shouldn`t be focused solely on making profits.
- It is better to refrain from trading if there are any conceivable risks that outweigh the potential profits (in this case, such a risk was manifested by a potentially disappointing earnings data). And even if the market does indeed go on to behave as the trader had initially anticipated, failing to trade on these initial expectations should not be perceived as a failure in itself. In trading, it is better to be consistent in your actions that right on some occasions.
Disclaimer: Your capital is at risk! Trading and investing on the financial markets carries a significant risk of loss. Each material, shown on this website, is provided for educational purposes only. A perfect, 100% accurate method of analysis does not exist. If you make a decision to trade or invest, based on the information from this website, you will be doing it at your own risk. Under no circumstances is Trendsharks responsible for any capital losses or damages you might suffer, while using the company’s products and services. For more information read our Terms & Conditions and Risk Disclaimer.


