The CADJPY pair has been threading within the boundaries of an ascending channel (Flag) since the middle of June, as it's about to be shown below, following a sizable downswing from a major resistance level. This muted price action manifested a temporary consolidation as the market was transitioning from having a definite bullish sentiment into adopting more bearish characteristics.
At present, the Canadian dollar is suffering from the same fallout that is weighing down heavily on the US dollar. Investors' flee from the greenback towards the euro, which process started last week following the conclusion of the pivotal meeting of EU Finance Ministers in Brussels. They sealed a landmark deal for a new relief package, which is aimed to induce stable recovery of the most impacted European economies. Thus, investors worldwide are starting to perceive the euro as the new go-to currency in the context of the coronavirus crisis, while the appeal of the dollar, and by that extend of the Loonie, is starting to wane.
Meanwhile, the demand for the yen is surging as most safe-havens are benefiting from the remarkable rally of gold. The price of the precious commodity is soaring and breaking records, which is having a positive spillover effect on the yen.
Thus, the underlying fundamentals seem to favour the formation of a new downswing on CADJPY's price action, which would entail a new transition of the underlying market sentiment from range-trading into trending.
1. Long-Term Outlook:
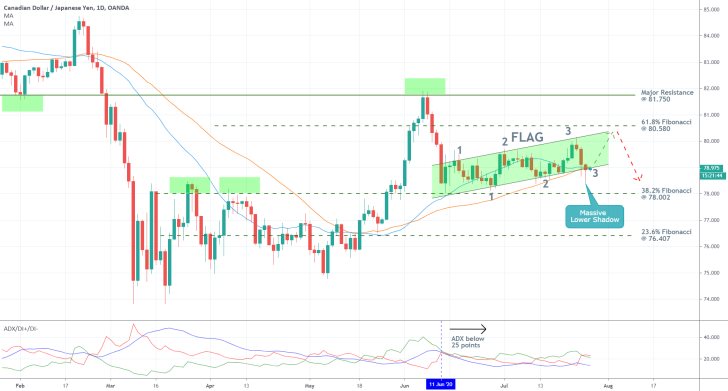
As can be seen on the daily chart below, the aforementioned downswing from a major resistance level occurred when the price action rebounded from the 81.750 level, and subsequently broke down below the 61.8 per cent Fibonacci retracement level at 80.580. The price action then found support just above the 38.2 per cent Fibonacci at 78.002. Following this, the pair started developing an ascending channel, which can be perceived as a flag. This is important because broader flag patterns typically entail a momentary consolidation before the market proceeds to head lower, which reflects on the primary expectations.
The price action has generated three points of contact with the flag's upper boundary in addition to concluding two points of contact with its lower boundary. Moreover, the price action is currently concentrating around the lower edge of the channel for the third time, which could lead to an imminent breakdown.
However, there is still a possibility for one final upswing towards the channel's upper limit, which is currently converging towards the 61.8 per cent Fibonacci retracement level, before it rebounds from it for a fourth consecutive time and goes on to establish a decisive breakdown. The convergence of the flag's upper edge with the 61.8 per cent Fibonacci bolsters the significance of the two, which thereby makes the 80.580 level an even more prominent resistance.

Notice that yesterday's price action established a candle with a small body and huge lower shadow, which underlines existing uncertainty in the market. It tested breaking down below the flag, but for the time being those attempts come to no avail. The CADJPY needs to close below the 50-day MA (in red) and the 30-day MA (in blue) before the significance of the rising bearish sentiment can be ascertained.
Once the market becomes trending and the CADJPY starts depreciating, the first major target for such a downtrend is encompassed by the 38.2 per cent Fibonacci retracement level at 78.000, which bears significant psychological importance. The next big goal would be the 23.6 per cent Fibonacci retracement level at 76.407.
Nevertheless, traders should be cautious of possible adverse fluctuations. The transition is still in its early stages, and the market remains to be ostensibly range-trading. This is confirmed by the ADX indicator, which has been threading below the 25-point benchmark since the 11th of June. Short-term erratic fluctuations are commonplace in such environments, which lack the directional swings of trending markets.
2. Short-Term Outlook:
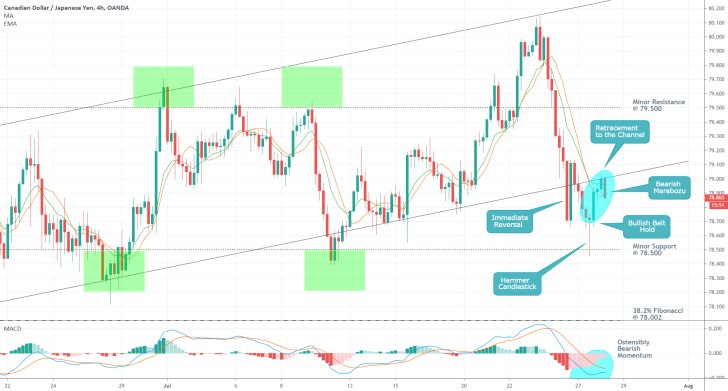
The 4H chart below demonstrates the reasons why the recent bullish correction might already be terminated. A snap rebound immediately followed the initial breakdown below the channel's lower boundary. Afterwards, the price action temporarily fell to the minor support level at 78.500 before retracing back to the channel's lower limit. This reversal is manifested by the hammer candlestick, which typically entails sudden prevalence of bullish sentiment.
The rising bullish commitment was quickly confirmed by the formation of a Bullish Belt Hold, which underscores the short-term correction in a broader downswing. The retracement then failed to break back into the area of the channel, which elucidates exhaustion of the short-term bullish pressures. Finally, the sharp bearish Marabozu candle exemplifies yet another change in the short-term market sentiment – this time from bullish to bearish.
As can be seen, the price action's rebound from the channel's lower limit comprises a significant indication of rising selling pressure, which is inlined with the reading of the MACD indicator. Not only that, but the last candle on the 4H chart closed below the 10-day EMA (in blue), which is positioned below the 10-day MA (in orange). This relationship signifies mounting selling pressure, and thereby the likely termination of the recent bullish correction.

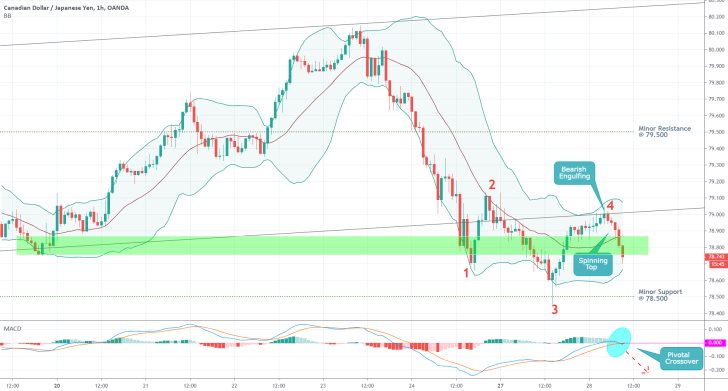
The overall downswing (as regarded from the last rebound from the channel's upper boundary) can be perceived as a classic bearish 1-5 impulse wave pattern, as postulated by the Elliott Wave Theory. The most recent retracement leg of the pattern (3-4) established the aforementioned peak just below the channel's lower limit. Even more significantly, the peak at point 4 is lower than the peak at point 2, which is inlined with the expectations of typical 1-5 impulse wave patterns.
Consequently, the market is now ready to establish a new impulse leg (4-5), which should fall below the bottom at point 3. This expectation is substantiated by the bearish crossover on the MACD, which takes place as the two EMAs comprising the indicator seem to rebound from the benchmark 0.000 per cent level. In other words, there is a sudden surge in underlying bearish momentum.
Moreover, the price action has already managed to break down below the lowest point of the previous downswing, as represented by the green area, in addition to breaking down below the middle line of the Bollinger Bands. All of these developments are congruent with the primary expectations.

3. Concluding Remarks:
The CADJPY is currently attempting to form a decisive breakdown below the broader flag pattern, which would represent a significant milestone in the market's transition from being ostensibly range-trading into becoming trending.
While the underlying bearish bias is more clearly discernible on charts with smaller timescales, things do not look so clear-cut on the daily chart. Traders should be aware of the possibility for one final rebound towards the channel's upper limit before the market gets fully ready to start depreciating.

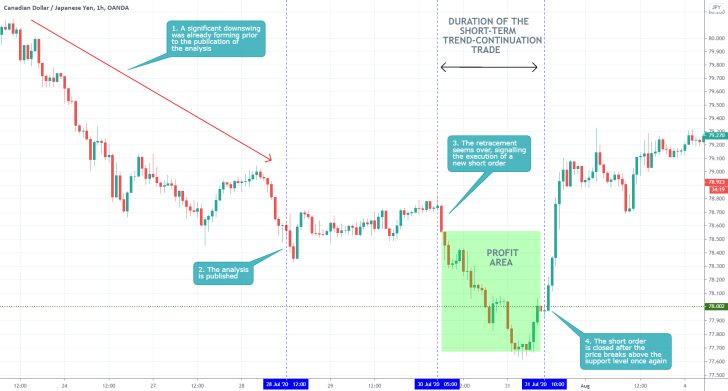
- The long-term expectations of the analysis were eventually proven wrong, because the market did not go on to establish a new downtrend after the breakdown below the support level at 78.002. Nevertheless, the execution of the short order was done at the right time – at the end of the minor retracement in the existing bearish trend (on the hourly chart above).
Disclaimer: Your capital is at risk! Trading and investing on the financial markets carries a significant risk of loss. Each material, shown on this website, is provided for educational purposes only. A perfect, 100% accurate method of analysis does not exist. If you make a decision to trade or invest, based on the information from this website, you will be doing it at your own risk. Under no circumstances is Trendsharks responsible for any capital losses or damages you might suffer, while using the company’s products and services. For more information read our Terms & Conditions and Risk Disclaimer.


