The price of Bitcoin has been recuperating since last week, after having fallen temporarily below the psychologically significant support level at 30000.0. Counterintuitively, perhaps, part of the reason for the strengthening of the cryptocurrency has been the latest clampdown on crypto exchanges by a financial regulatory.
The FCA in the UK announced that Binance, the world's largest cryptocurrency exchange, is not permitted to "undertake any regulated activity" in the UK. Even though the crypto industry continues to be embroiled in uncertainty as financial regulators keep on restricting the operations of crypto exchanges, this seems to be bolstering aggregate demand in the short term.
Demand seems to be driven by investors' desire to 'catch the next big movement', which, for the time being, is offsetting the negative pressures that stem from the controversies that continue to weigh down heavily on the broader industry. However, traders should be wary of too much market enthusiasm.
As is about to be seen below, the price of Bitcoin is currently consolidating, and a momentary breakout above the range would very likely cause an upsurge in optimism. It is quite possible to start hearing forward-looking remarks, such as "Bitcoin at $100 thousand" once again. Traders should refrain from formulating their own perceptions based on the general opinions that circulate on the internet.
Such a temporary breakout is more likely to create a so-called 'bullish trap', which would prompt buyers to action. Nevertheless, the broader outlook remains prevailingly bearish. These conditions create a recipe for disaster for bulls.
That is why bulls should remain patient, whereas bears can start looking for an opportunity to sell.
Minding the Elliott Wave Theory
The most significant bearish indication can be observed in relation to the Elliott Wave Theory. As can be seen on the daily chart below, the last rally represents a massive 1-5 impulse wave pattern (in green). Once the pattern peaked around 64000.0, a new bearish trend started developing (in red).
It can be seen quite clearly that the price action has established the second impulse leg (2-3) of the bearish 1-5 pattern, which means that it is currently developing the second retracement leg (3-4). This bullish upswing would probably underpin the aforementioned bullish trap - traders going long at the peak of point 4 while the price gets ready to tumble towards point 5.
This is most likely to take place from the 38.2 per cent Fibonacci retracement level at 43983.0, which underscores the upper boundary of the Resistance Area (in red). Adding the descending trend line (in black) to the equation gives us an approximate time when such a reversal is likely to take place - the 19th of July. This is inferred from the crossover of the trend line with the 38.2 per cent Fibonacci.
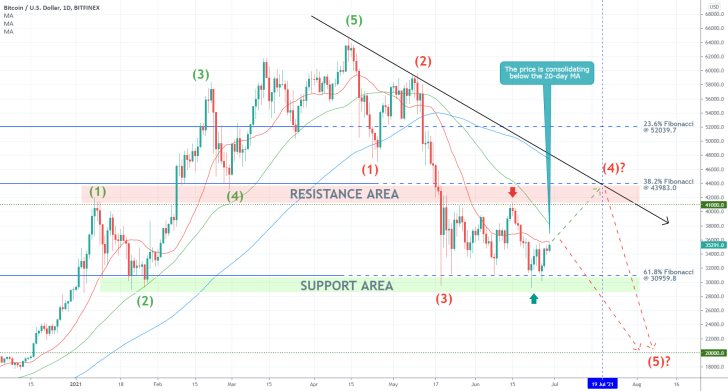
That is why ideally, bears should look for an opportunity to sell within the Resistance area, which spans between 43983.0 and the major resistance level at 41000.0. They would be eyeing the final impulse leg of the 1-5 pattern, which is likely to head towards the psychologically significant support level at 20000.0 over the next several months.
There is, however, a slim chance that a decisive bearish reversal occurs sooner than that. If the price action were to retrace back from the 20-day MA (in red) and subsequently were to break down below the 61.8 per cent Fibonacci at 30959.8, this would signal the immediate beginning of a new downtrend.
Conversely, bulls trying to ride the 3-4 retracement leg towards the 38.2 per cent Fibonacci retracement level should consider joining the market only if the price action manages to penetrate above the 20-day MA. Better yet, they can wait for a decisive breakout above the 50-day MA (in green).
Probing the Regression Channel
The 4H chart below shows that the price action is currently testing a major make-it-or-break-it threshold. Case in point, the upper boundary of the regression channel, which coincides with the 100-day MA (in blue).
If it succeeds in breaking out above the two, the price would then be able to probe the minor 61.8 per cent Fibonacci retracement at 36677.2. These minor correction levels are drawn against the last downswing (represented by the regression channel).
Bulls looking to join the market soon should look for a consolidation of the price action above 36677.2 as a strong indication of buying bias in the market.
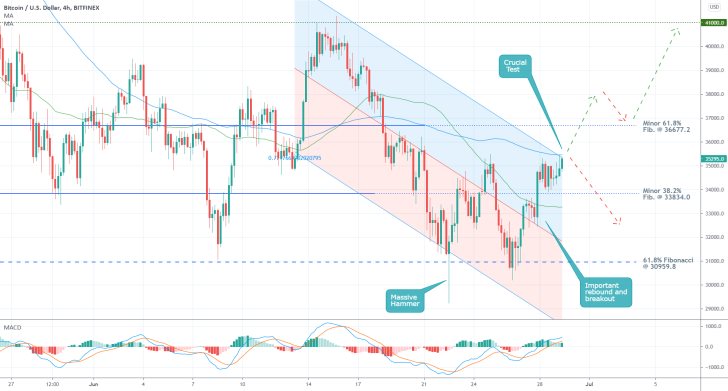
In contrast, an imminent reversal from the 100-day MA and the upper boundary of the regression channel would signify rising bearish bias in the short term. If the price goes on to penetrate below the minor 38.2 per cent Fibonacci at 33834.0 afterwards, this could be utilised by bears eyeing a likely continuation of the downtrend towards the next psychological target - at 30959.8.
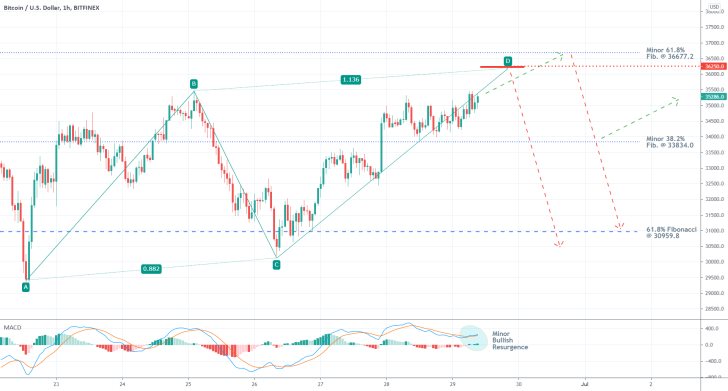
The hourly chart below outlines the likelihood of such a bearish reversal occurring in the near future. As can be seen, the price action appears to be developing an ABCD pattern, which is set to peak just below the minor 61.8 per cent Fibonacci retracement level.
This waning bullish momentum is underpinned by the MACD indicator.
Concluding Remarks
On the one hand, more cautious bears can wait for the price to peak around 44000.00, as stated earlier, before they utilise contrarian trading strategies.
On the other, less risk-averse traders can join the market sooner than that, on the condition that the price action reverses from the 36677.2 - 36250.0 area. They should place a tight stop-loss order just above the minor 61.8 per cent Fibonacci.
Their first target is underpinned by the minor 38.2 per cent Fibonacci, where a bullish rebound could occur. If, however, the price does manage to break down below it, then the next target would be 30959.8.
Bitcoin Advances Within a Bearish Bat Pattern
A very interesting trading setup is currently unfolding on the price of Bitcoin, resembling the structure of a Bearish Bat closely. As the price of Bitcoin advances in the short term, the likelihood of another reversal becomes increasingly more probable.
BTCUSD has been consolidating in a narrow range over the last few days because of low market liquidity. It is being caused by diminished trading activity as there are not a lot of events on the calendar to stir traders' interest.
Given this relatively subdued environment, which is typified by lacking fundamentals to drive the market in either direction, all trading setups in the short term would be dependent solely on a precise technical analysis.
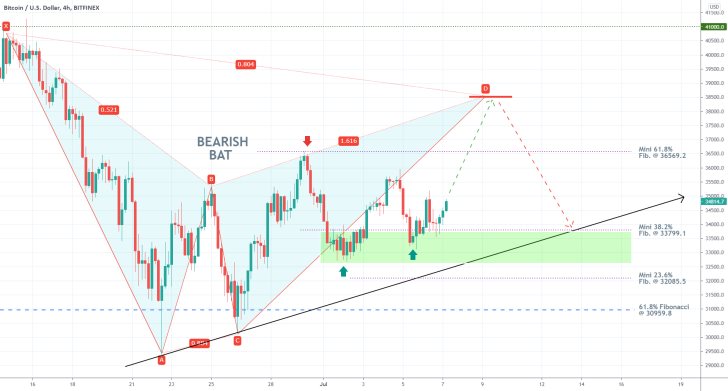
As can be seen on the 4H chart above, the price action is currently developing the impulse leg of a major Bearish Bat pattern. This type of structure entails a potential reversal once the price action reaches its peak at point D. This is determined based on the proportionality between the other dips and peaks of the pattern.
In other words, Bitcoin advances for the time being, with buying pressure taking prevalence over selling pressure at present. However, once the price climbs to point D (at 38500.00), bears would have an excellent opportunity to utilise contrarian trading strategies. They could look for a chance to enter short there, eyeing another dropdown towards the ascending trend line (in black).
Meanwhile, bulls seeking a chance to take advantage of the current upswing towards point D should take notice of the consolidation area (in green) just below the minor 38.2 per cent Fibonacci retracement level at 33799.1. The minor Fibonacci retracement levels are drawn against the last downswing (0-A).
This consolidation area encompasses the risk of adverse fluctuations for bulls looking to enter long around the current market price. There is a relatively high probability of the price falling back within said area once more before it can continue climbing towards D.
Even still, the general outlook for bulls is pretty good, given that the potential profit (from the current spot price to point D) outweighs the potential risk (the area between 33800.0 and the ascending trend line). It satisfies the 1:3 risk to reward ratio, making it a calculated risk.
Pennant Breakout Play Developing on Bitcoin
The price of Bitcoin is currently consolidating within an increasingly narrower range in anticipation of a significant breakout in the near future. This subdued behaviour of the price action is creating a bottleneck, which is likely to precede such a massive breakout.
This market environment is creating suitable conditions for bulls to enter near the lower end of said consolidation range before the price resumes its directional trading. In other words, the underlying environment is suitable for the implementation of trend continuation trading strategies.
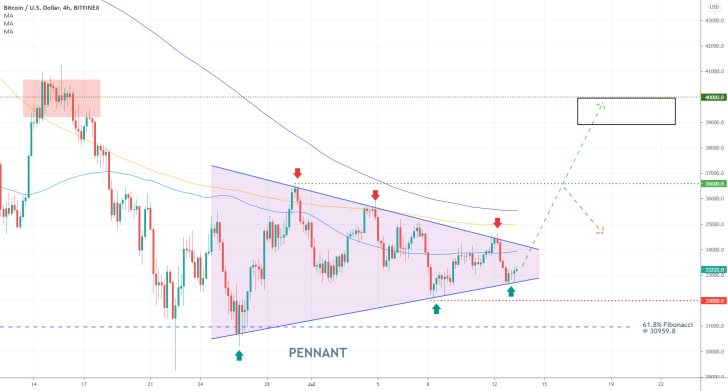
As can be seen on the 4H chart above, the aforementioned consolidation is taking the shape of a Pennant pattern. And the bottleneck is underpinned by the progressively narrower waves that have been established lately.
Notice that the upper and lower boundaries of the Pennant have been tested on three separate occasions each. This implies that the next time the price action tests the upper limit of the Pennant is when a decisive breakout is most likely to take place. Hence, bulls can start weighing in on the possibility of entering the market around the current spot price.
For the time being, however, the prevalence of strong bearish pressure is epitomised by the fact that the price action remains concentrated below the three moving averages - the 100-day MA (in blue), the 150-day MA (in orange), and the 200-day MA (in purple). This perfect descending order would represent a major obstacle for any potential breakouts.
The second swing low of the Pennant underscores the associated risk for bulls. That is the major support level at 32000.0. Meanwhile, the second swing high of the Pennant pinpoints the first major target for such a breakout - the major resistance level at 36600.0.
If the price action does not turn around from said resistance, then the next likely target can be found near the psychologically significant resistance at 40000.0. This is where the last Distribution zone can be found, highlighted by the area in red.
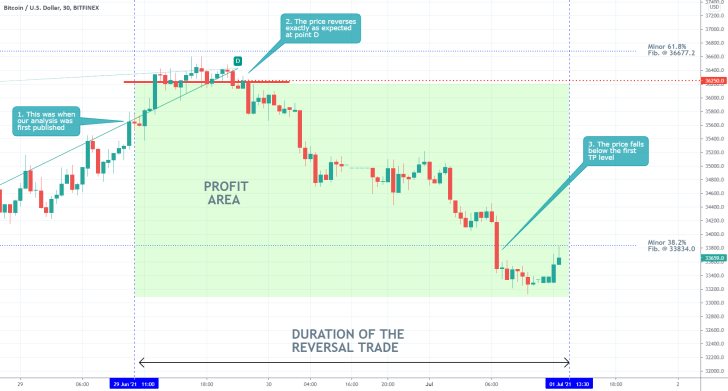
- The reversal on the price of Bitcoin occurred exactly as forecasted by our analysis - at the top of an ABCD pattern. The resulting dropdown reached the first target at the minor 38.2 per cent Fibonacci retracement level at 33834.0.
- There is not much more that can be said here. The trade was executed precisely.
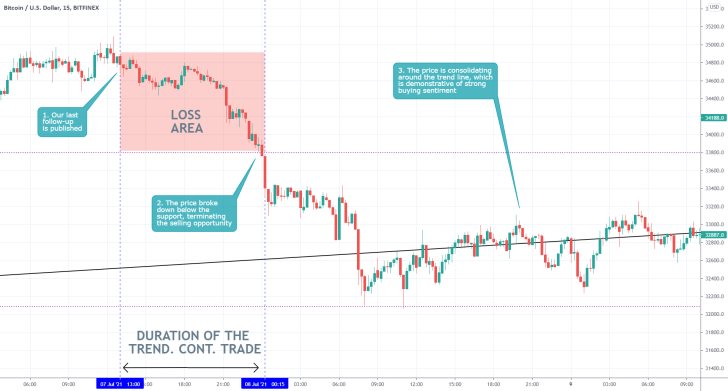
- The price of the BTCUSD did not resume to climb immediately after the release of our last follow-up analysis. Instead, it penetrated below the closest support level and went on to consolidate around the ascending trend line.
- This represents one of those examples where bulls whose initial orders were wiped out by the dropdown could have re-entered at the next dip.
- When the price triggers your stop-loss order that does not automatically mean that you are completely wrong about the underlying market environment.
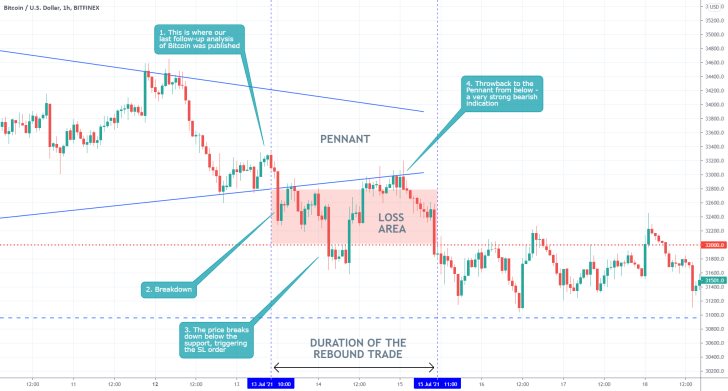
- Our last follow-up analysis of Bitcoin was mistaken in anticipating a breakout above the Pennant. Instead, the price action dropped to the closest support level before establishing a temporary consolidation range.
- It is worth pointing out the throwback to the Pennant from below following the initial breakdown. This throwback represented a crucial bearish indication and could have been used as a new sell signal.
Disclaimer: Your capital is at risk! Trading and investing on the financial markets carries a significant risk of loss. Each material, shown on this website, is provided for educational purposes only. A perfect, 100% accurate method of analysis does not exist. If you make a decision to trade or invest, based on the information from this website, you will be doing it at your own risk. Under no circumstances is Trendsharks responsible for any capital losses or damages you might suffer, while using the company’s products and services. For more information read our Terms & Conditions and Risk Disclaimer.


