The price of gold has been depreciating over the last couple of weeks after having reached a psychological barrier. The downturn was catalysed by mixed labour data in the U.S. and growing energy demand globally.
The correction is momentarily halted by increased bullish momentum in the short term. The latter is owing to relaxed inflation fears among traders and investors, ahead of the highly anticipated FED meeting later this week.
This behaviour of the commodity's price action entails very interesting opportunities for the implementation of trend-continuation trading strategies. In particular, market bears could wait for the pullback to peak before they can resume placing selling orders. The downtrend is expected to continue diving deeper afterwards.
Eying the Elliott Correction in the Descending Channel
The broader forecasts for continued price depreciation are manifested by the expectations of the Elliott Wave Theory. As was demonstrated in our previous analysis of gold, the commodity has already completed a massive bearish 1-5 impulse wave pattern. This implies the likely emergence of an ABC correction as a consequence.
As can be seen on the daily chart below, the price action has already established a peak at point A, which itself takes the form of a minor 1-5 impulse wave pattern. What is especially interesting is the fact that this early stage of the broader correction peaked at the 61.8 per cent Fibonacci retracement leg at 1917.50.
The latter manifests the aforementioned barrier of psychological importance. The subsequent reversal from the resistance initiated the beginning of the AB retracement leg. Therefore, the bearish AB leg is likely to continue falling towards the next prominent support - potentially, the 38.2 per cent Fibonacci at 1827.33.
The retracement AB leg takes the form of a descending channel (FLAG), which itself is likely to progress in an ABC pattern. In other words, the temporary bullish pullback is expected to peak at the minor point B (potentially near the upper boundary of the channel) before the downtrend is resumed towards C (the broader B).
The broader bearish sentiment is supported by the decisive breakdown below the 20-day MA (in red), which took the form of a Bearish Engulfing candle. However, the resurging bullish momentum in the shorter term is elucidated by the subsequent emergence of a Hammer Candle.
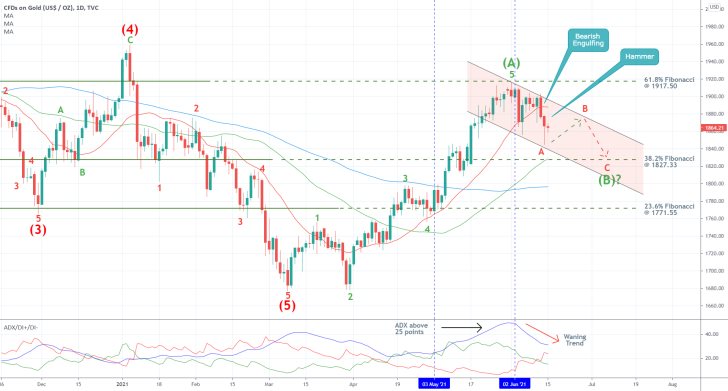
The overall market sentiment remains ostensibly trending, as is demonstrated by the ADX indicator. It has been threading above the 25-point benchmark since the 3rd of May. Nevertheless, the ADX peaked on the 2nd of June, right around the time the price action reversed from the 61.8 per cent Fibonacci. The strength of the underlying trend has been waning from that point on, which makes it more likely for the price to continue depreciating.
At present, the price action remains concentrated below the 20-day MA, which highlights the strong bearish pressure in the short term. Accordingly, the 50-day MA (in green) is drawing near the 61.8 per cent Fibonacci, making it a potential turning point. This is to be expected since the ABC correction would be comprised of an additional impulse leg (BC).
Examining the Current Consolidation
The price action temporarily consolidates within a very narrow range before continuing to climb higher towards point B. Notice that the consolidation commenced following the rebound from the 200-day MA (in orange). This represented the first test of the moving average following two preceding tests of the 150-day MA (in purple).
Thus, the lower end of the consolidation range was established at 1860.00. This support is going to play a key role as a make-it-or-break-it threshold for the direction of the price in the near future.
Notice also that the price action had attempted to rebound back above the psychologically significant resistance at 1900.00 on two separate occasions but has failed to do so both times. This is demonstrative of bearish pressure rising even in the short term.
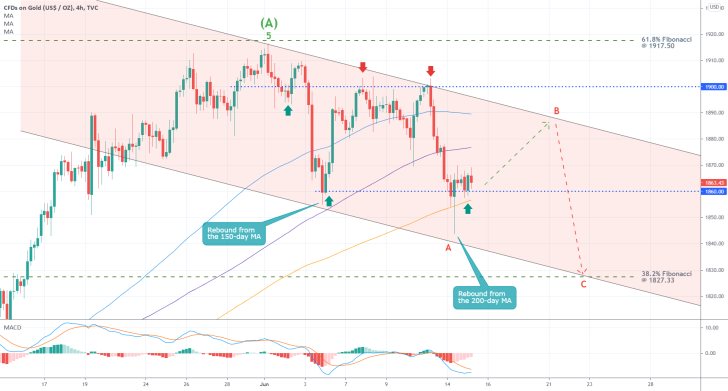
The underlying bearish momentum is probably about to attempt turning temporarily bullish, which can be discerned by the stochastic chart on the MACD indicator. Nevertheless, even if the pullback is extended slightly higher, it is likely to be terminated somewhere below the psychological resistance at 1900.00.
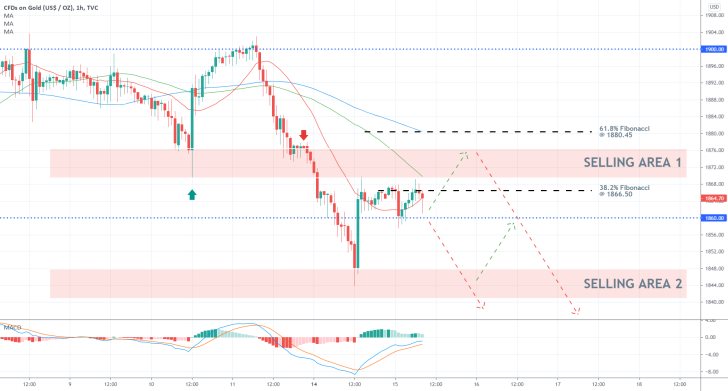
Bears should look for an opportunity to sell at the top of the current pullback in anticipation of continued price depreciation afterwards. Such a peak is likely to be reached once the latest wave on the MACD (as seen on the hourly chart below) climaxes.
Meanwhile, the two minor Fibonacci levels (in black) represent retracements from the latest downswing. Hence, if the price manages to break out above the 50-day MA and the 38.2 per cent Fibonacci, it is likely to head towards the 61.8 per cent Fibonacci. The latter is currently converging with the 100-day MA (in blue), making it an even more prominent turning point.
Conversely, on the condition that the price action reverses from the 38.2 per cent Fibonacci and subsequently breaks down below the 1860.00 support level decisively, this would imply that the price may be ready to start falling right away.
Concluding Remarks:
Depending on one's level of risk-aversion, bears can take advantage of this setup in one of two ways. For less risk-averse traders, they can execute short orders within the boundaries of Selling Area 1. They have to place tight stop-loss orders not far away from the 61.9 per cent Fibonacci at 1880.45.
For traders needing even more selling confirmations, they can wait for a decisive breakdown below 1860.00 to occur before they join the resumed downtrend. The biggest risk for them would be manifested by potential throwbacks to 1860.00 from below, so they would have to place their stop losses accordingly.
As was mentioned earlier, the closest target of prominence for both is the same - the 38.2 per cent Fibonacci retracement level (as seen on the daily chart) at 1827.33.
Gold Bulls Waiting for a Decisive Breakout
The price of gold is currently consolidating within the boundaries of a narrow range as the general liquidity in the market diminishes. This will entail interesting trading opportunities if the price action manages to establish a decisive breakout.
The horizontal price action is owing to greatly reduced trading activity, as more and more market participants go for their summer holidays. The resulting range-trading environment is suitable for the implementation of trend continuation strategies. However, bulls would have to wait for such a decisive breakout.
Nevertheless, the possibility for sustained price depreciation should not be overlooked entirely. The June payrolls in the U.S., which are scheduled for release on Friday, could catalyse a new dropdown as the dollar continues to strengthen.
That is why the manner in which the price action leaves the consolidation range would be demonstrative of where it is most likely to go next.
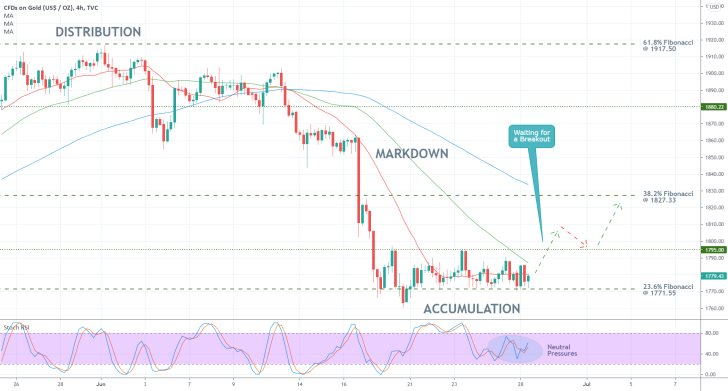
As can be seen on the 4H chart above, the price action is indeed consolidating within an Accumulation range, as postulated by the Wyckoff Cycle theory. The latter spans between the 23.6 per cent Fibonacci retracement level at 1771.55 (look at the initial analysis to learn more about the chosen Fib. Corrections) and the major resistance at 1795.00.
The former's significance stems from the fact that it marks a major Fibonacci correction, whereas the latter's importance is derived from the fact that it is positioned relatively close to the psychologically significant resistance level at 1800.00. Hence, a breakdown/breakout above the boundaries of the Accumulation would demonstrate where the market is likely to go next.
Presently, the price action is being concentrated around the 20-day MA (in red) and below the 50-day MA (in green). It would have to break out above the two as they serve the roles of floating resistances.
A potential breakout above the Accumulation's upper boundary is likely to be followed by a throwback to 1795.00 from above. The first major target for such a renewed Markup would be underpinned by the 38.2 per cent Fibonacci retracement at 1827.33.
Bulls should only consider going long if the price penetrates above 1795.00. In contrast, bears can do the same if the price of Gold manages to close below the 23.6 per cent Fibonacci.
Both should take into consideration the fact that, at present, the underlying market sentiment in the short term is entirely neutral. The Stochastic RSI indicator underscores this. Since there is no prevalence in either direction, both bulls and bears should wait for the underlying pressure to become more one-sided.
Gold Flirting with a Range Bottom Amidst a Supply Glut
The price of gold is currently consolidating around a critical support level as concerns of a global supply glut continue to rise. The manner in which the price behaves around this crucially important make-it-or-break-it threshold would underpin where the commodity is headed next.
The commodities market is currently being affected by the uneven pace of the global economic recovery. In particular, aggregate demand is outstripping global supply, which is creating sizable supply gluts, otherwise known as supply bottlenecks. This was alluded to by Andrew Bailey, Governor of the Bank of England, earlier today.
It is these ripples in the supply chains that cause heightened demand for many commodities, including gold. The same is currently being observed on the price of crude oil. The question is whether this alone would be enough to drive XAUUSD higher, especially amidst the recuperating dollar?
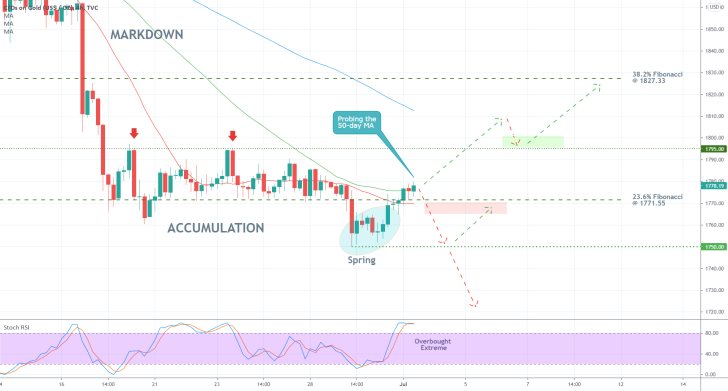
As can be seen on the 4H chart above, the price of gold is still flirting with the bottom of the Accumulation range, as postulated by the Wyckoff Cycle Theory. The range spans between the 23.6 per cent Fibonacci retracement level at 1771.55 and the major resistance level at 1795.00. The significance of the latter stems from the fact that it is positioned quite close to the psychological resistance at 1800.00.
The emergence of a Spring just below the range bottom is demonstrative of rising bullish bias; however, this alone does not necessarily mean that the price is poised to continue climbing uninterrupted.
In addition to testing the 23.6 per cent Fibonacci retracement level, the price action is also consolidating between the 20-day MA (in red) and the 50-day MA (in green). This is the aforementioned make-it-or-break-it threshold.
If the price manages to break out above the three decisively, the next most likely direction would be the upper boundary of the range. More risk-averse traders can wait for a breakout above it in order to go long at the subsequent pullback (area in green).
On the other hand, a breakdown below the lower boundary of the range would allow bears to have another go at a potentially deeper dive (area in red). A throwback to the 23.6 per cent Fibonacci would allow them to add to their selling orders.
If the price manages to penetrate below the last bottom (at 1750.00), this will allow bears to move their stop orders to breakeven.
At present, the Stochastic RSI indicator is ostensibly overbought, which, given the range-trading conditions, is demonstrative of a probable continuation of the dropdown.
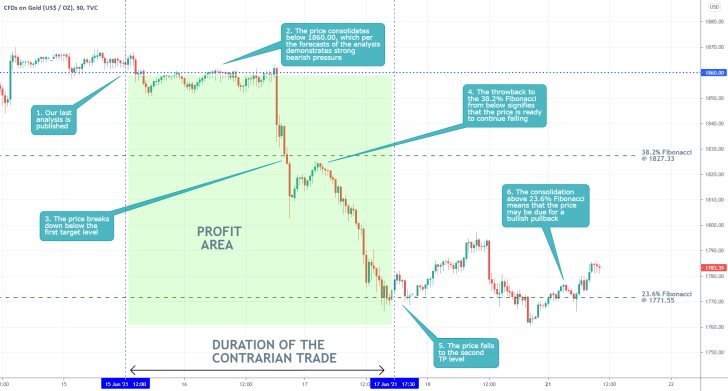
- The price of gold behaved exactly as per the expectations of our last analysis. It started falling shortly after the material was published. The catalyst for the massive downturn was FED's June meeting.
- The price action reached the first target level at the 38.2 per cent Fibonacci retracement level at 1827.33 before falling to the next TP level - the 23.6 per cent Fibonacci at 1771.55. Its current consolidation above the latter implies the possibility for a minor bullish pullback.
- This is a good example of why traders need to have the mental capacity to refrain from getting out of the market prematurely. It would have been a mistake to cash everything out at the 38.2 per cent Fibonacci. To protect themselves against such mental strain, they can utilise floating stop orders once the price reaches their first target.
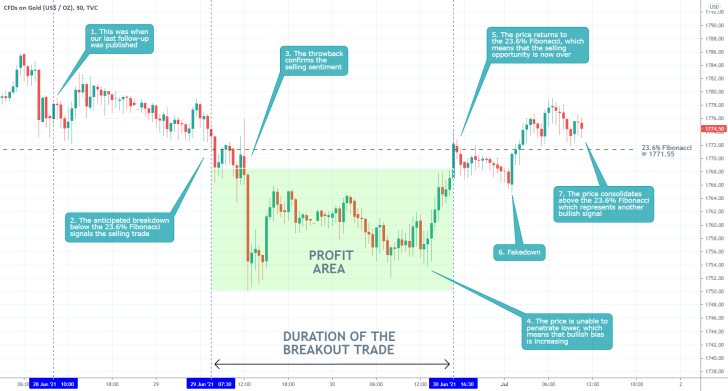
- The price of gold broke down below the 23.6 per cent Fibonacci retracement level at 1771.55 shortly after the publication of our last follow-up analysis. This represented the trigger for the execution of a selling order.
- However, the price did not go on to sink far, as it rebounded shortly afterwards.
- Sometimes even with a good entry, your trades are not going to pan out. Traders shouldn't be frustrated as this is a normal part of the general trading experience.
Disclaimer: Your capital is at risk! Trading and investing on the financial markets carries a significant risk of loss. Each material, shown on this website, is provided for educational purposes only. A perfect, 100% accurate method of analysis does not exist. If you make a decision to trade or invest, based on the information from this website, you will be doing it at your own risk. Under no circumstances is Trendsharks responsible for any capital losses or damages you might suffer, while using the company’s products and services. For more information read our Terms & Conditions and Risk Disclaimer.


